![[Deprecated]](figures/lifecycle-deprecated.svg)
Usage
vis_bar(
.data,
.by = NA,
.meta = NA,
.errorbars = c(0.025, 0.975),
.errorbars.off = FALSE,
.stack = FALSE,
.points = TRUE,
.test = TRUE,
.signif.label.size = 3.5,
.errorbar.width = 0.2,
.defgroupby = "Sample",
.grouping.var = "Group",
.labs = c("X", "Y"),
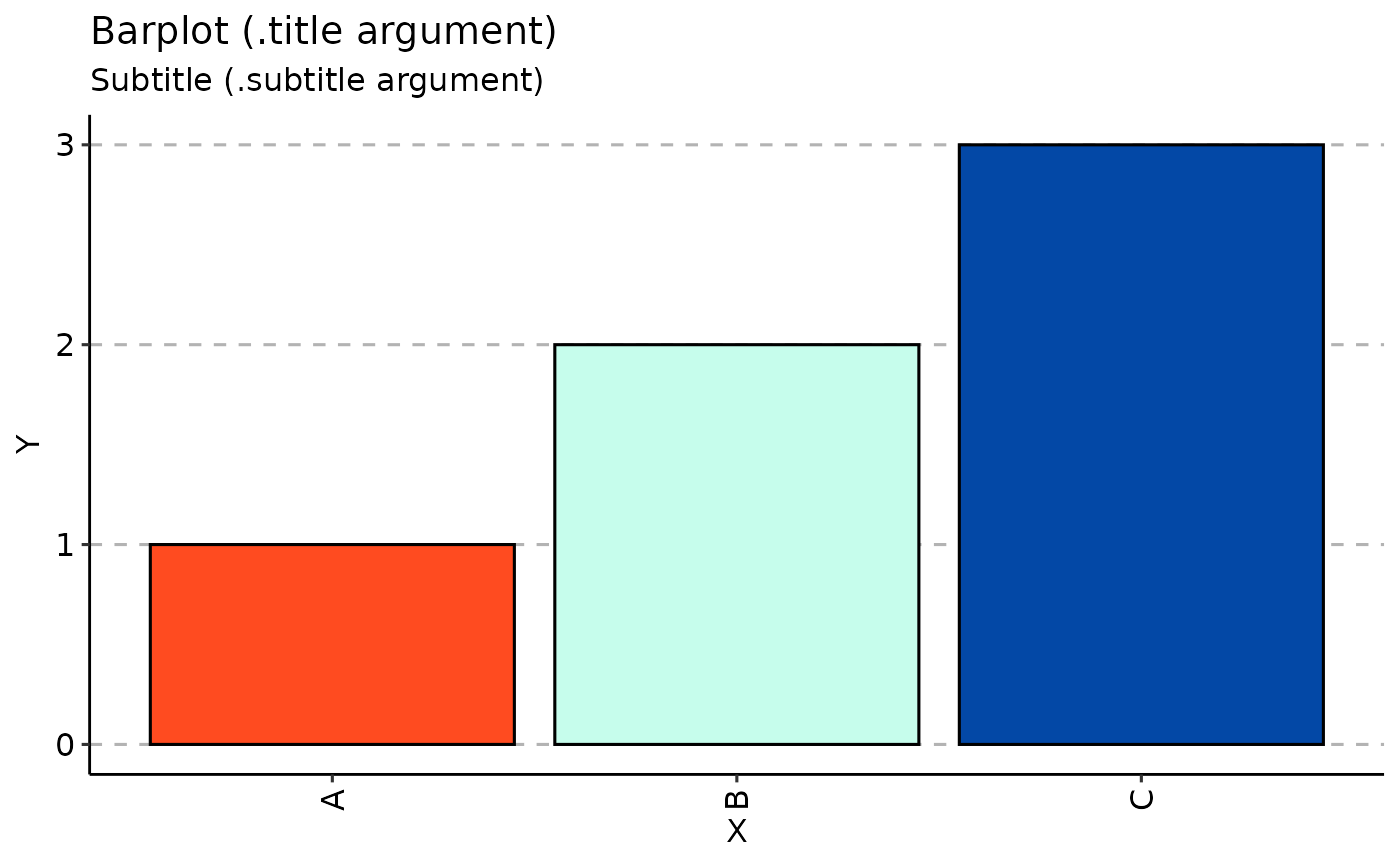
.title = "Barplot (.title argument)",
.subtitle = "Subtitle (.subtitle argument)",
.legend = NA,
.leg.title = "Legend (.leg.title argument)",
.legend.pos = "right",
.rotate_x = 90
)Arguments
- .data
Data to visualise.
- .by
Pass NA if you want to plot samples without grouping.
You can pass a character vector with one or several column names from ".meta" to group your data before plotting. In this case you should provide ".meta".
You can pass a character vector that exactly matches the number of samples in your data, each value should correspond to a sample's property. It will be used to group data based on the values provided. Note that in this case you should pass NA to ".meta".
- .meta
A metadata object. An R dataframe with sample names and their properties, such as age, serostatus or hla.
- .errorbars
A numeric vector of length two with quantiles for error bars on sectors. Disabled if ".errorbars.off" is TRUE.
- .errorbars.off
If TRUE then plot CI bars for distances between each group. Disabled if no group passed to the ".by" argument.
- .stack
If TRUE and .errorbars.off is TRUE then plot stacked bar plots for each Group or Sample
- .points
A logical value defining whether points will be visualised or not.
- .test
A logical vector whether statistical tests should be applied. See "Details" for more information.
- .signif.label.size
An integer value defining the size of text for p-value.
- .errorbar.width
Numeric. Width for error bars.
- .defgroupby
A name for the column with sample names.
- .grouping.var
A name for the column to group by.
- .labs
A character vector of length two specifying names for x-axis and y-axis.
- .title
The text for the plot's title.
- .subtitle
The text for the plot's subtitle.
- .legend
If TRUE then displays a legend, otherwise removes legend from the plot.
- .leg.title
The text for the plots's legend. Provide NULL to remove the legend's title completely.
- .legend.pos
Positions of the legend: either "top", "bottom", "left" or "right".
- .rotate_x
How much the x tick text should be rotated? In angles.
Examples
# \dontrun{
vis_bar(data.frame(Sample = c("A", "B", "C"), Value = c(1, 2, 3)))

# }
# }