![[Deprecated]](figures/lifecycle-deprecated.svg)
repClonality function encompasses several methods to measure
clonal proportions in a given repertoire.
Arguments
- .data
The data to be processed. Can be data.frame, data.table::data.table, or a list of these objects.
Every object must have columns in the immunarch compatible format. immunarch_data_format
Competent users may provide advanced data representations: DBI database connections, or a list of these objects. They are supported with the same limitations as basic objects.
Note: each connection must represent a separate repertoire.
- .method
A String with one of the following options:
"clonal.prop","homeo","top"or"rare".Set
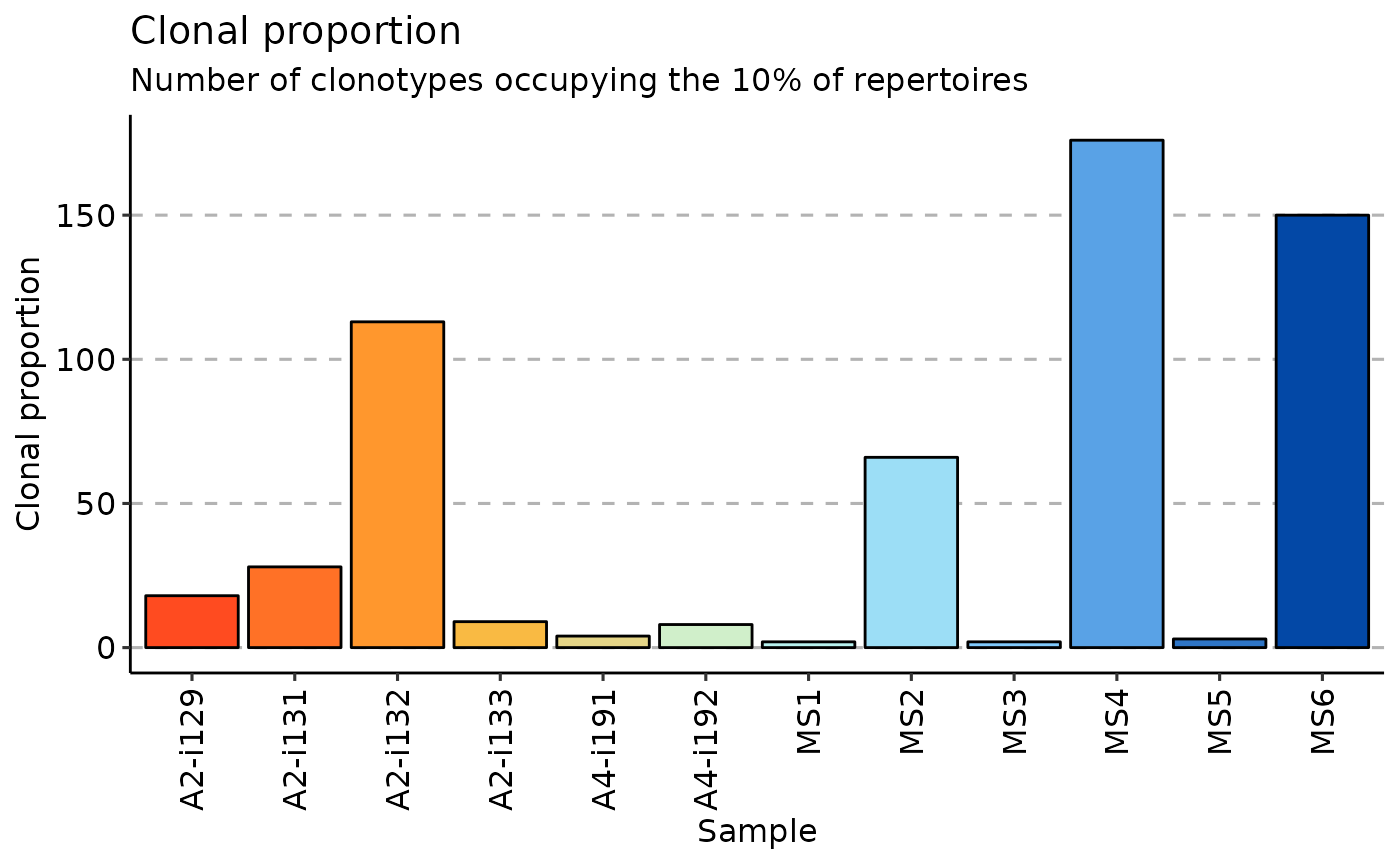
"clonal.prop"to compute clonal proportions or in other words percentage of clonotypes required to occupy specified by.percpercent of the total immune repertoire.Set
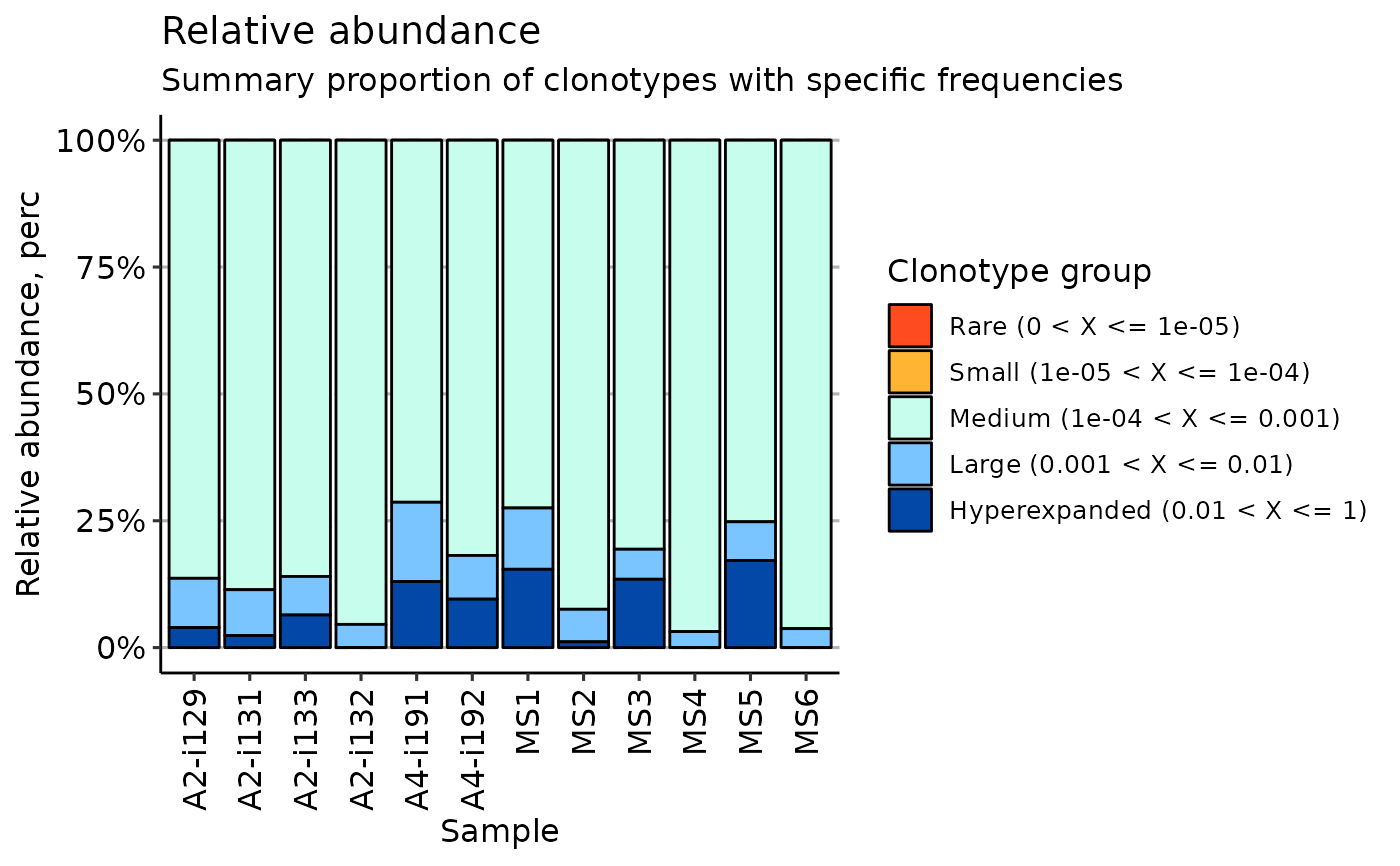
"homeo"to analyse relative abundance (also known as clonal space homeostasis), which is defined as the proportion of repertoire occupied by clonal groups with specific abundances..Set
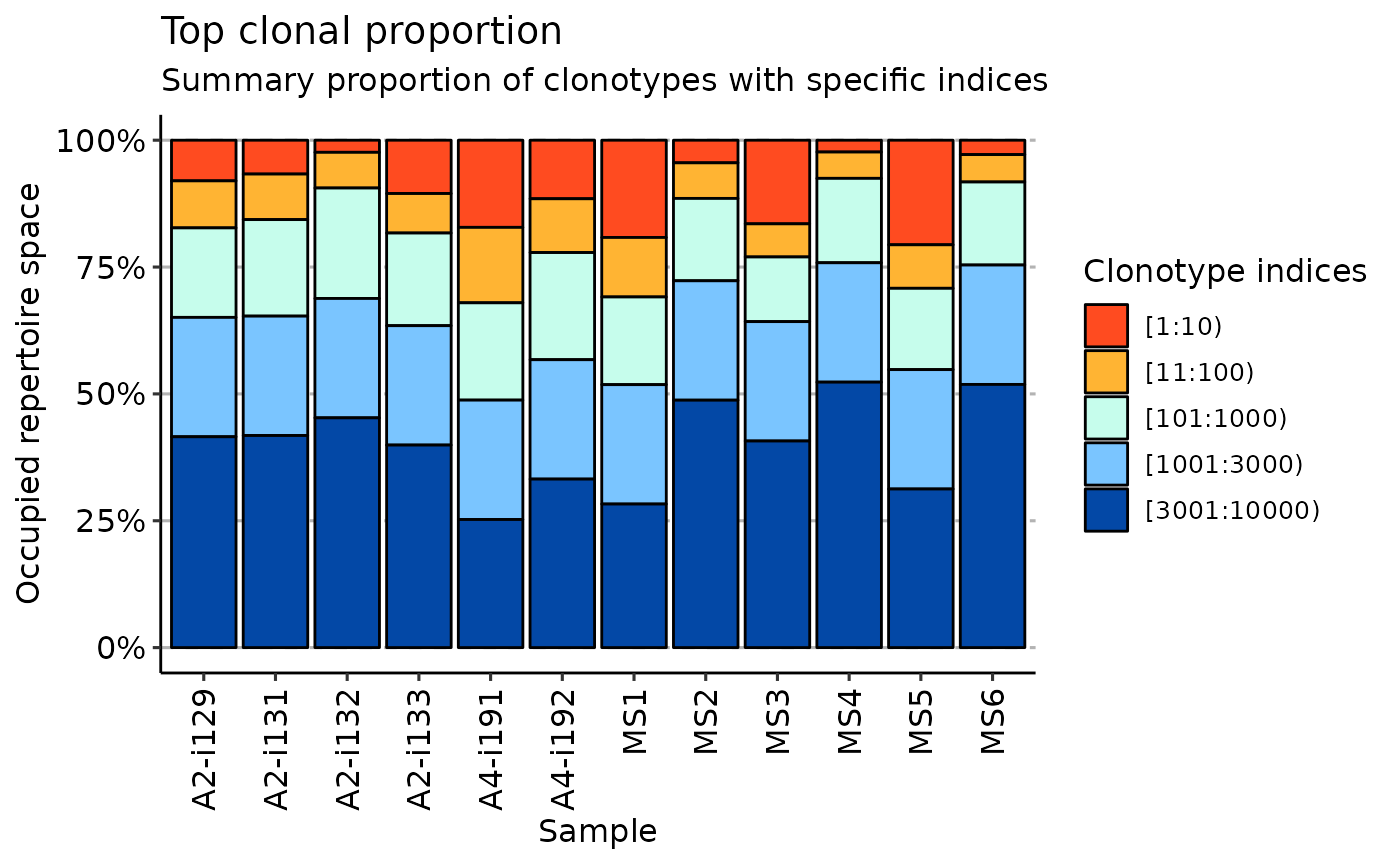
"top"to estimate relative abundance for the groups of top clonotypes in repertoire, e.g., ten most abundant clonotypes. Use".head"to define index intervals, such as 10, 100 and so on.Set
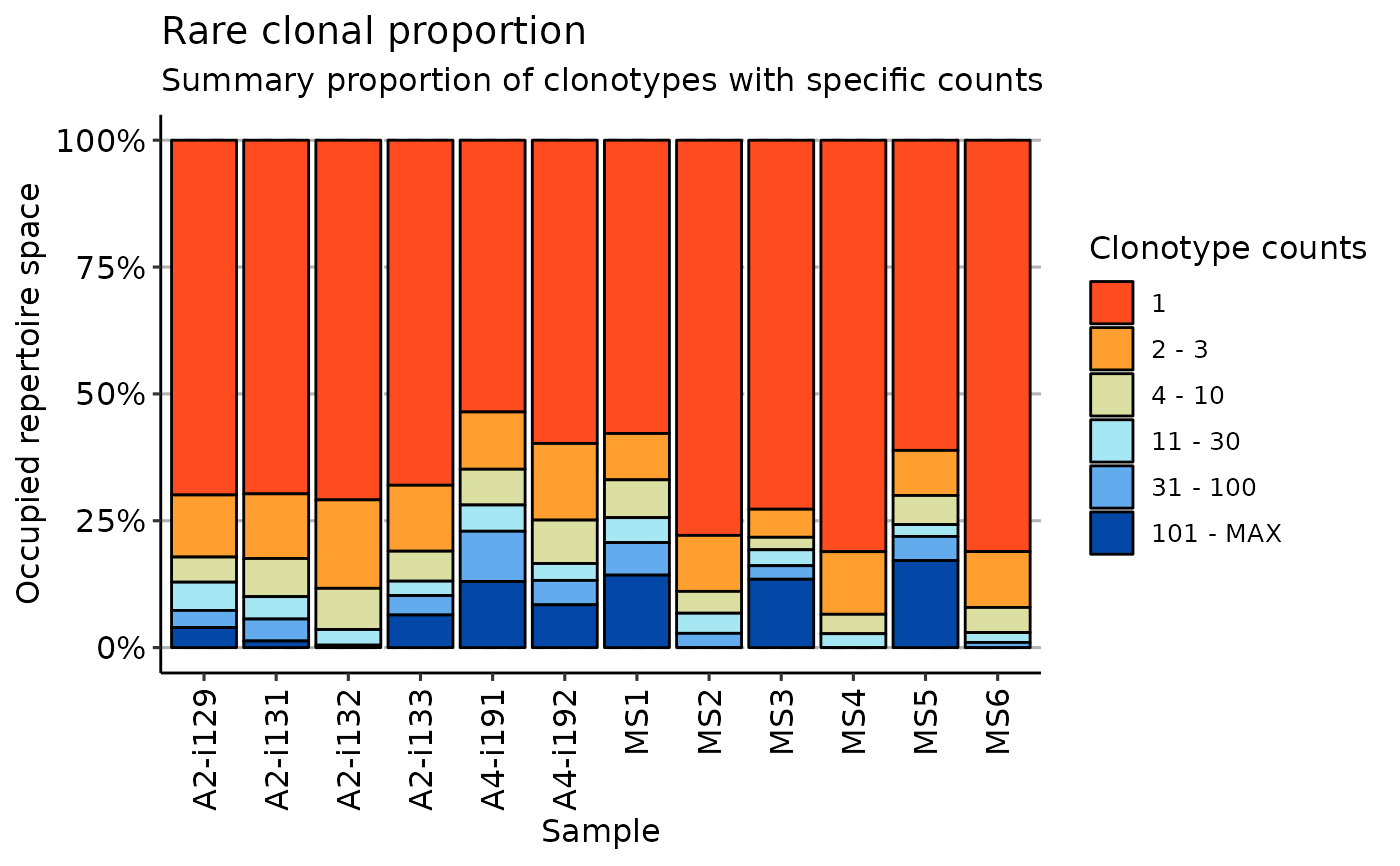
"rare"to estimate relative abundance for the groups of rare clonotypes with low counts. Use".bound"to define the threshold of clonotype groups.- .perc
A single numerical value ranging from 0 to 100.
- .clone.types
A named numerical vector with the threshold of the half-closed intervals that mark off clonal groups.
- .head
A numerical vector with ranges of the top clonotypes.
- .bound
A numerical vector with ranges of abundance for the rare clonotypes in the dataset.
Value
If input data is a single immune repertoire, then the function returns a numeric vector with clonality statistics.
Otherwise, it returns a numeric matrix with clonality statistics for all input repertoires.
Details
Clonal proportion assessment is a different approach to estimate repertoire diversity. When visualised, it allows for thorough examination of immune repertoire structure and composition.
In its core this type of analysis is similar to the relative species abundance concept in ecology. Relative abundance is the percent composition of an organism of a particular kind relative to the total number of organisms in the area.
A stacked barplot of relative clonotype abundances can be therefore viewed as a non-parametric approach to comparing their underlying distributions.
Examples
# Load the data
data(immdata)
imm_pr <- repClonality(immdata$data, .method = "clonal.prop")
vis(imm_pr)
 imm_top <- repClonality(immdata$data, .method = "top", .head = c(10, 100, 1000, 3000, 10000))
vis(imm_top)
#> Using Sample as id variables
imm_top <- repClonality(immdata$data, .method = "top", .head = c(10, 100, 1000, 3000, 10000))
vis(imm_top)
#> Using Sample as id variables
 imm_rare <- repClonality(immdata$data, .method = "rare")
vis(imm_rare)
#> Using Sample as id variables
imm_rare <- repClonality(immdata$data, .method = "rare")
vis(imm_rare)
#> Using Sample as id variables
 imm_hom <- repClonality(immdata$data, .method = "homeo")
vis(imm_hom)
imm_hom <- repClonality(immdata$data, .method = "homeo")
vis(imm_hom)