vis() is a lightweight, quick-look plotting helper.
It's designed to help you visualise results fast with sensible defaults.
It automatically detects the input type and chooses an appropriate visualisation
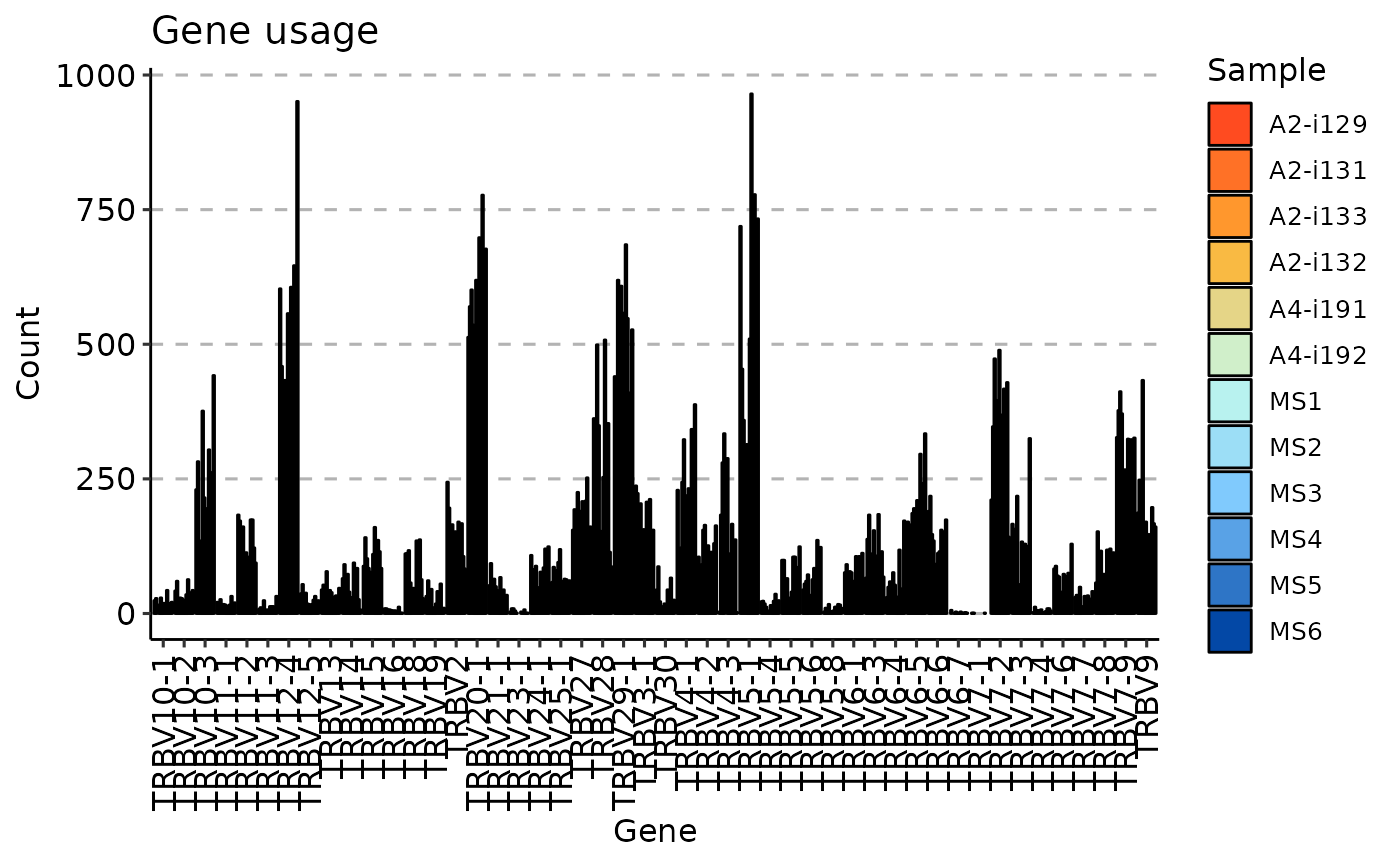
(e.g., output from airr_stats_genes() is recognised as gene usage values and plotted
without extra arguments).
vis() is not intended for publication-quality figures. For serious, highly customised, or publication-ready plots, I recommend building your graphics directly with ggplot2.
See also
fixVis for precise manipulation of plots.
Examples
# \dontrun{
immdata <- get_test_idata() |> agg_repertoires("Therapy")
#> Rows: 2 Columns: 4
#> ── Column specification ────────────────────────────────────────────────────────
#> Delimiter: "\t"
#> chr (4): File, Therapy, Response, Prefix
#>
#> ℹ Use `spec()` to retrieve the full column specification for this data.
#> ℹ Specify the column types or set `show_col_types = FALSE` to quiet this message.
#> ℹ Found 2/2 repertoire files from the metadata on the disk
#> ✔ Metadata parsed successfully
#>
#> ── Reading repertoire data
#>   1. /home/runner/work/_temp/Library/immundata/extdata/tsv/sample_0_1k.tsv
#>   2. /home/runner/work/_temp/Library/immundata/extdata/tsv/sample_1k_2k.tsv
#> ℹ Checking if all files are of the same type
#> ✔ All files have the same extension
#>
#> ── Renaming the columns and schemas
#> ✔ Renaming is finished
#>
#> ── Preprocessing the data
#>   1. exclude_columns
#>   2. filter_nonproductive
#> ✔ Preprocessing plan is ready
#>
#> ── Aggregating the data to receptors
#> ℹ No locus information found
#> ℹ Processing data as immune repertoire tables - no counts, no barcodes, no chain pairing possible
#> ✔ Execution plan for receptor data aggregation and annotation is ready
#>
#> ── Joining the metadata table with the dataset using 'filename' column
#> ✔ Joining plan is ready
#>
#> ── Postprocessing the data
#>   1. prefix_barcodes
#> ✔ Postprocessing plan is ready
#>
#> ── Saving the newly created ImmunData to disk
#> ℹ Writing the receptor annotation data to [/tmp/RtmpPHpsgz/file1eef7b55a650/annotations.parquet]
#> ℹ Writing the metadata to [/tmp/RtmpPHpsgz/file1eef7b55a650/metadata.json]
#> ✔ ImmunData files saved to [/tmp/RtmpPHpsgz/file1eef7b55a650]
#> ℹ Reading ImmunData files from [/tmp/RtmpPHpsgz/file1eef7b55a650]
#> ✔ Loaded ImmunData with the receptor schema: [c("cdr3_aa", "v_call") and list()]
#> ℹ Reading ImmunData files from [/tmp/RtmpPHpsgz/file1eef7b55a650]
#>
#> ── Summary
#> ℹ Time elapsed: 2.31 secs
#> ✔ Loaded ImmunData with the receptor schema: [c("cdr3_aa", "v_call") and NULL]
#> ✔ Loaded ImmunData with [1902] chains
airr_stats_genes(immdata, gene_col = "v_call") |> vis()

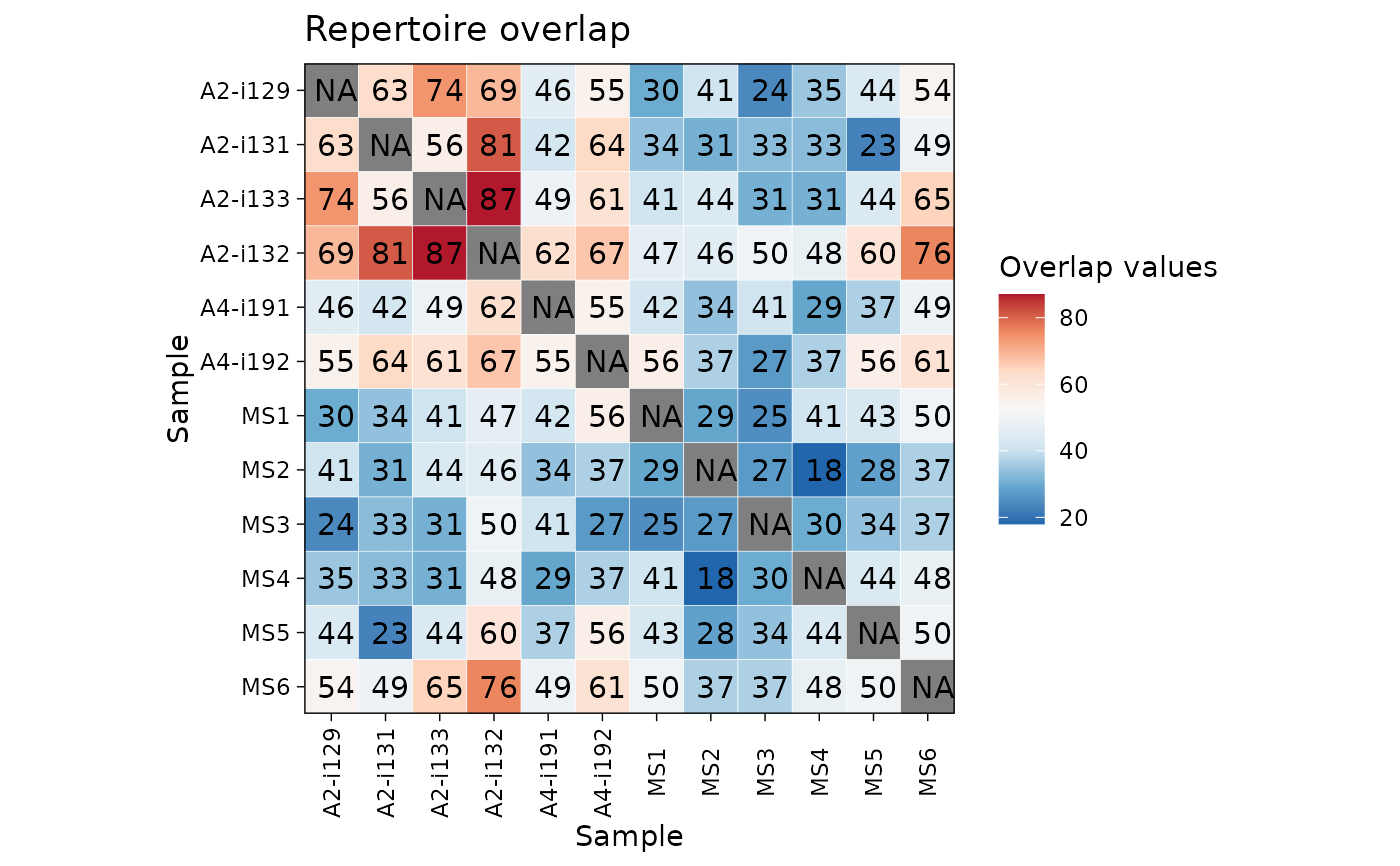
airr_public_jaccard(immdata) |> vis()

airr_diversity_pielou(immdata) |> vis()

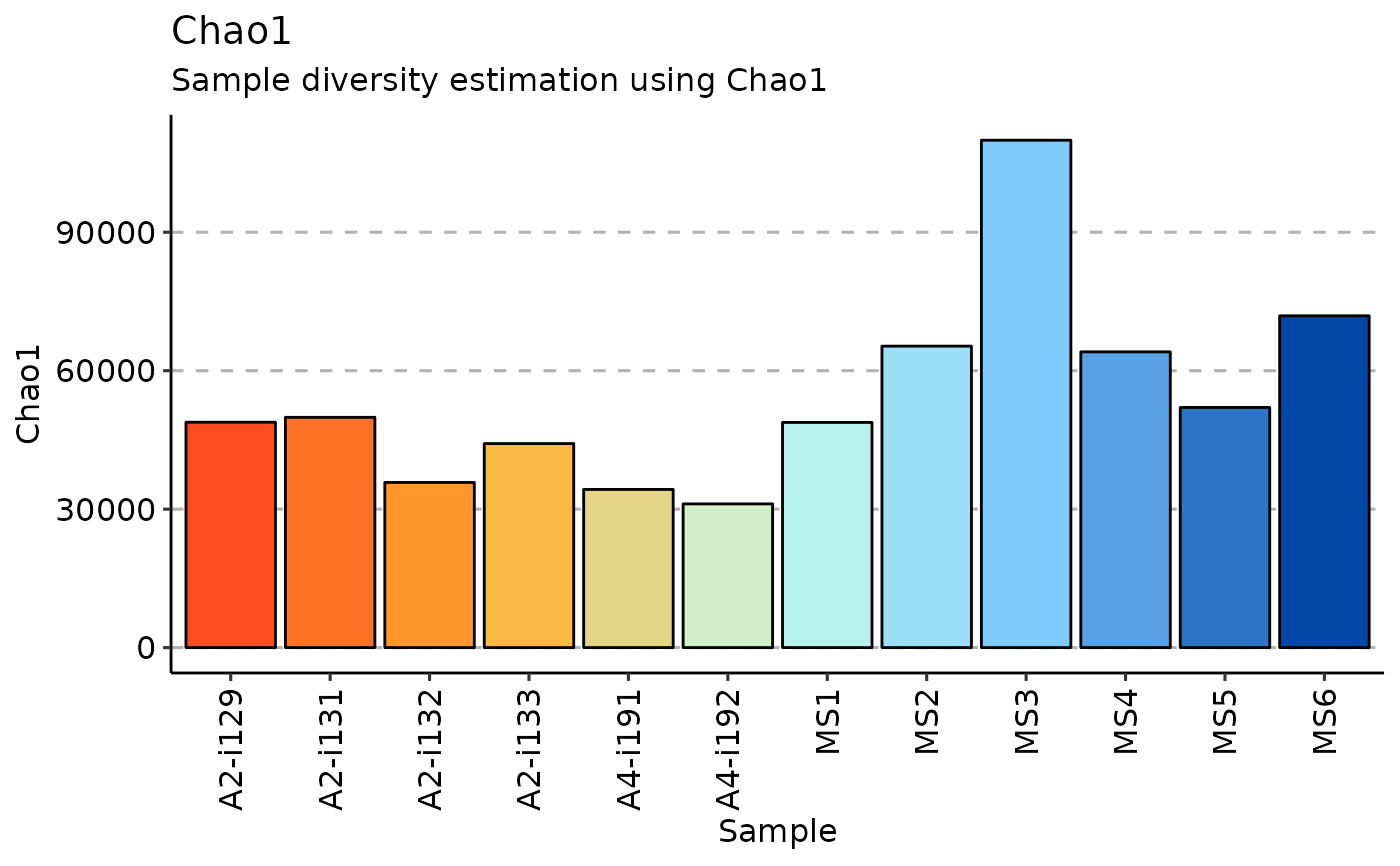
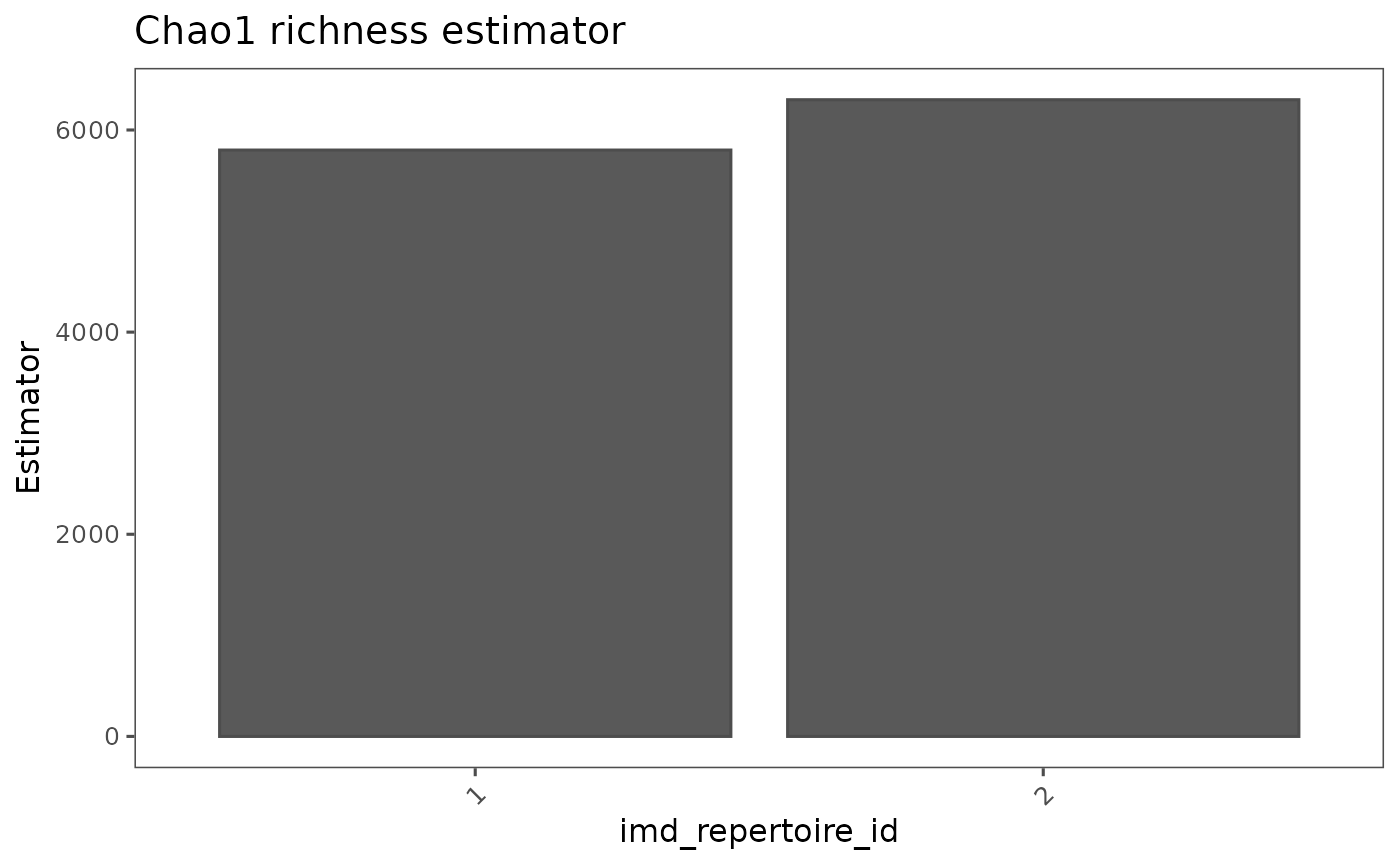
airr_diversity_chao1(immdata) |> vis()

airr_clonality_prop(immdata)
#> # A duckplyr data frame: 4 variables
#>   imd_repertoire_id clonal_prop_bin occupied_prop Therapy
#>               <int> <chr>                   <dbl> <chr>
#> 1                 1 Hyperexpanded          0.0126 ICI
#> 2                 2 Hyperexpanded          0.0243 CAR-T
#> 3                 1 Large                  0.987  ICI
#> 4                 2 Large                  0.976  CAR-T
# }