Usage
# S3 method for class 'immunr_inc_overlap'
vis(.data, .target = 1, .grid = FALSE, .ncol = 2, ...)
Arguments
- .data
Output from the repOverlap function that uses "top" methods.
- .target
Index of a repertoire to plot. Omitted if .grid is TRUE.
- .grid
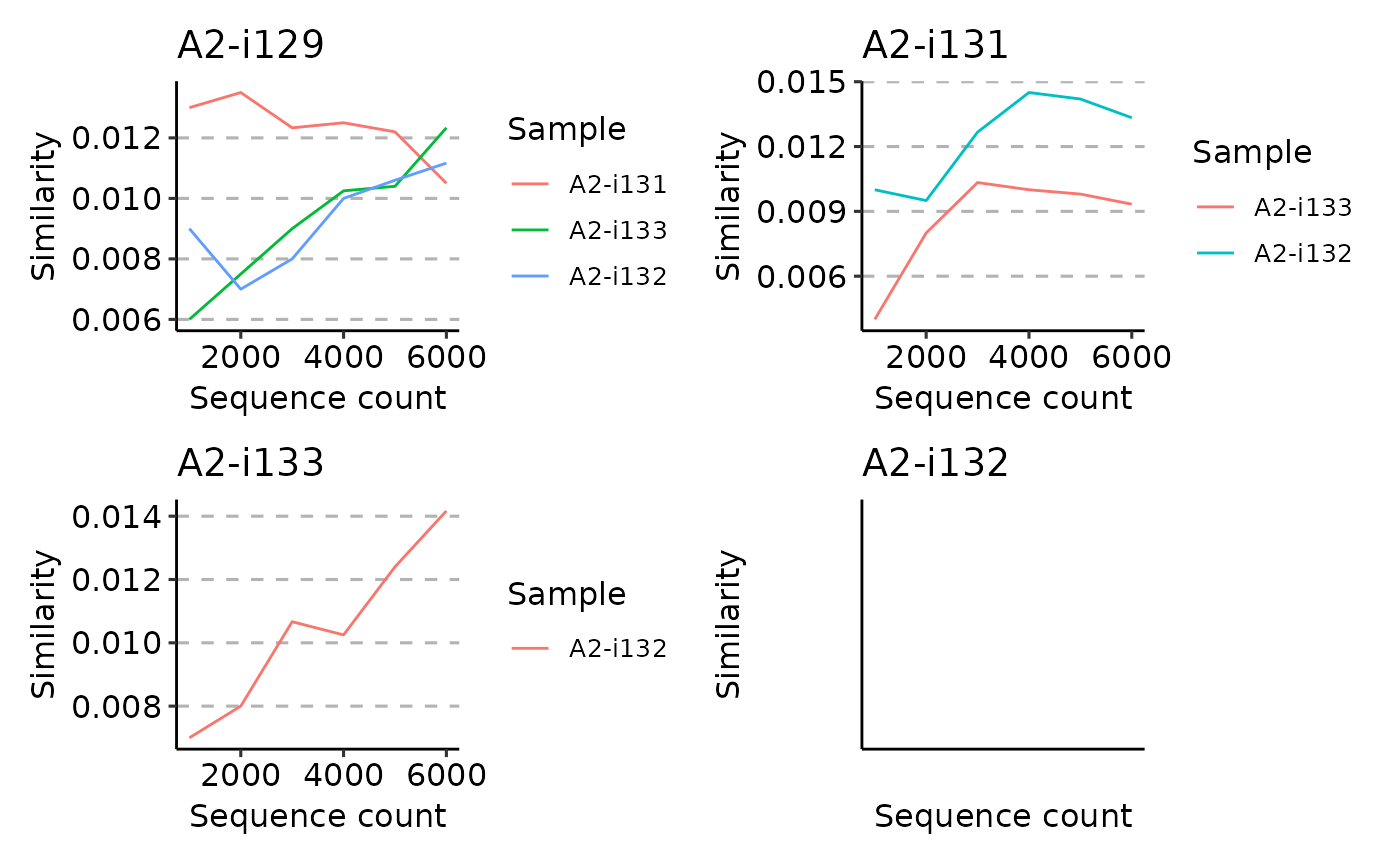
Logical. If TRUE then plot all similarities in a grid.
- .ncol
Numeric. Number of columns in the resulting grid.
- ...
Not used here.
Examples
# \dontrun{
data(immdata)
tmp <- repOverlap(immdata$data[1:4], "inc+overlap", .verbose.inc = FALSE, .verbose = FALSE)
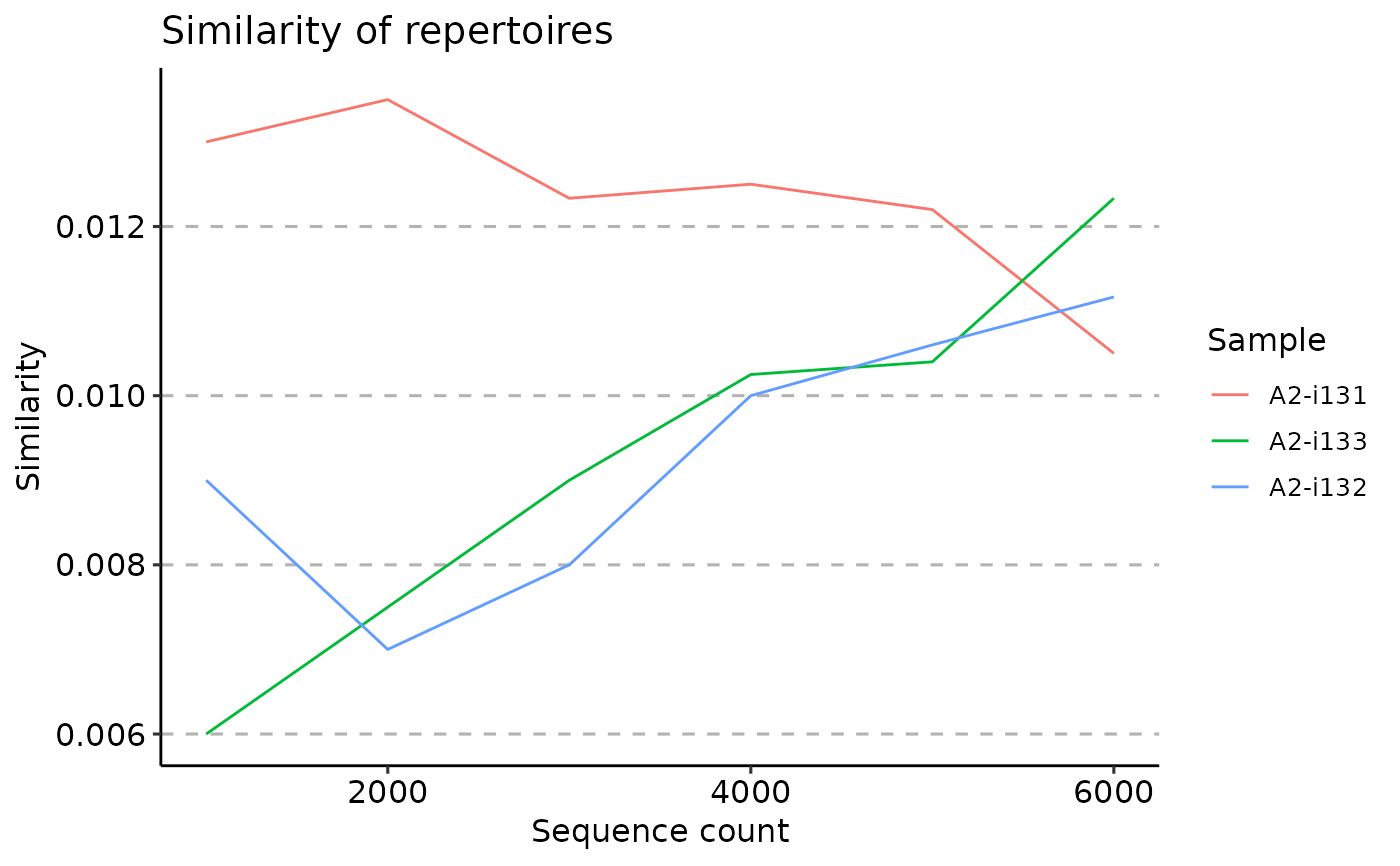
vis(tmp, .target = 1)

vis(tmp, .grid = TRUE)

# }
# }