![[Deprecated]](figures/lifecycle-deprecated.svg)
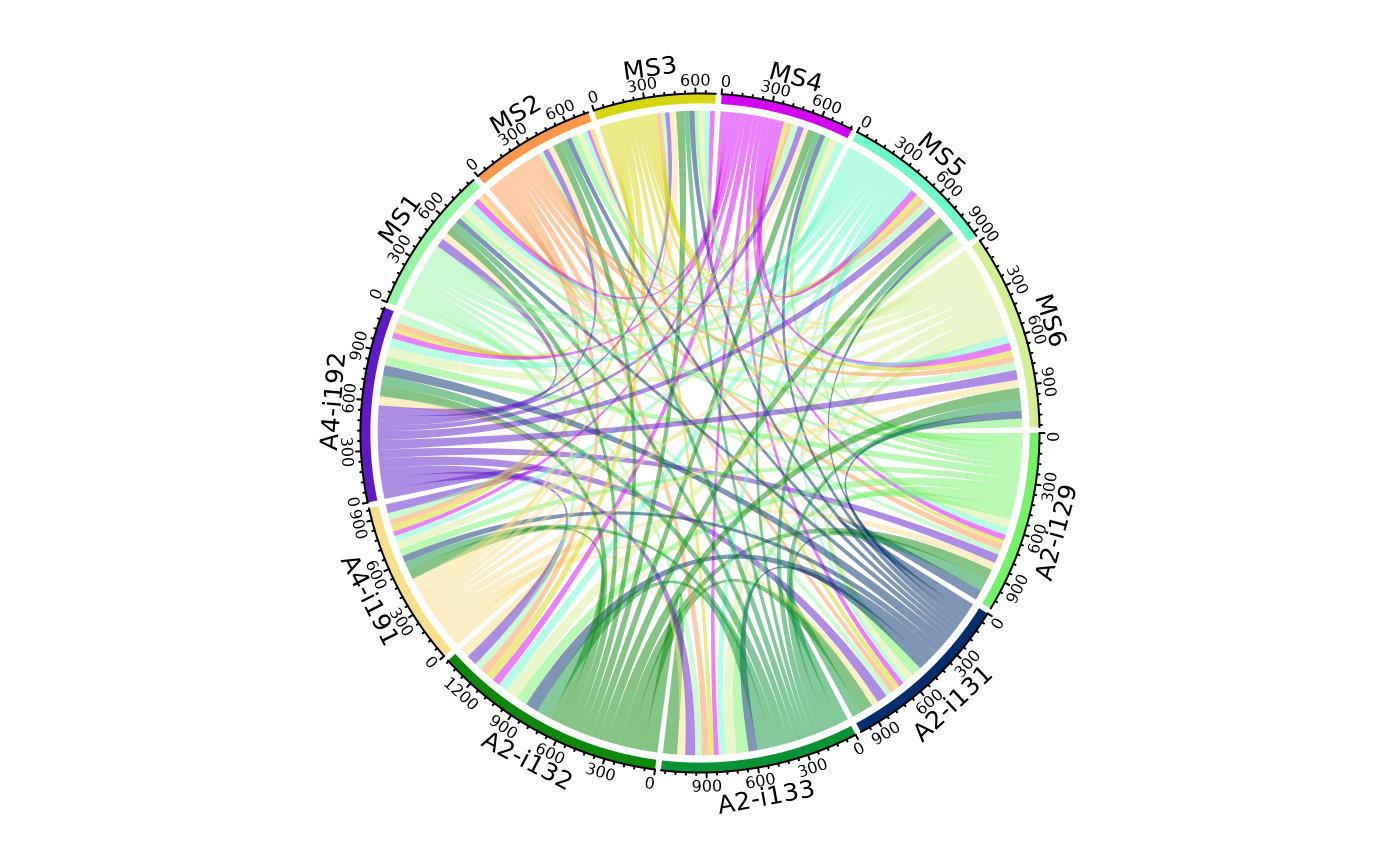
Visualise matrices with the circlize::chordDiagram function from the circlize package.
Arguments
- .data
Input matrix.
- .title
The The text for the title of the plot.
- ...
Other arguments passed to circlize::chordDiagram from the 'circlize' package.
Examples
# \dontrun{
data(immdata)
ov <- repOverlap(immdata$data)
vis(ov, .plot = "circos")

# }
# }