![[Deprecated]](figures/lifecycle-deprecated.svg)
Plot sequence logo plots for visualising of amino acid motif sequences / profiles.
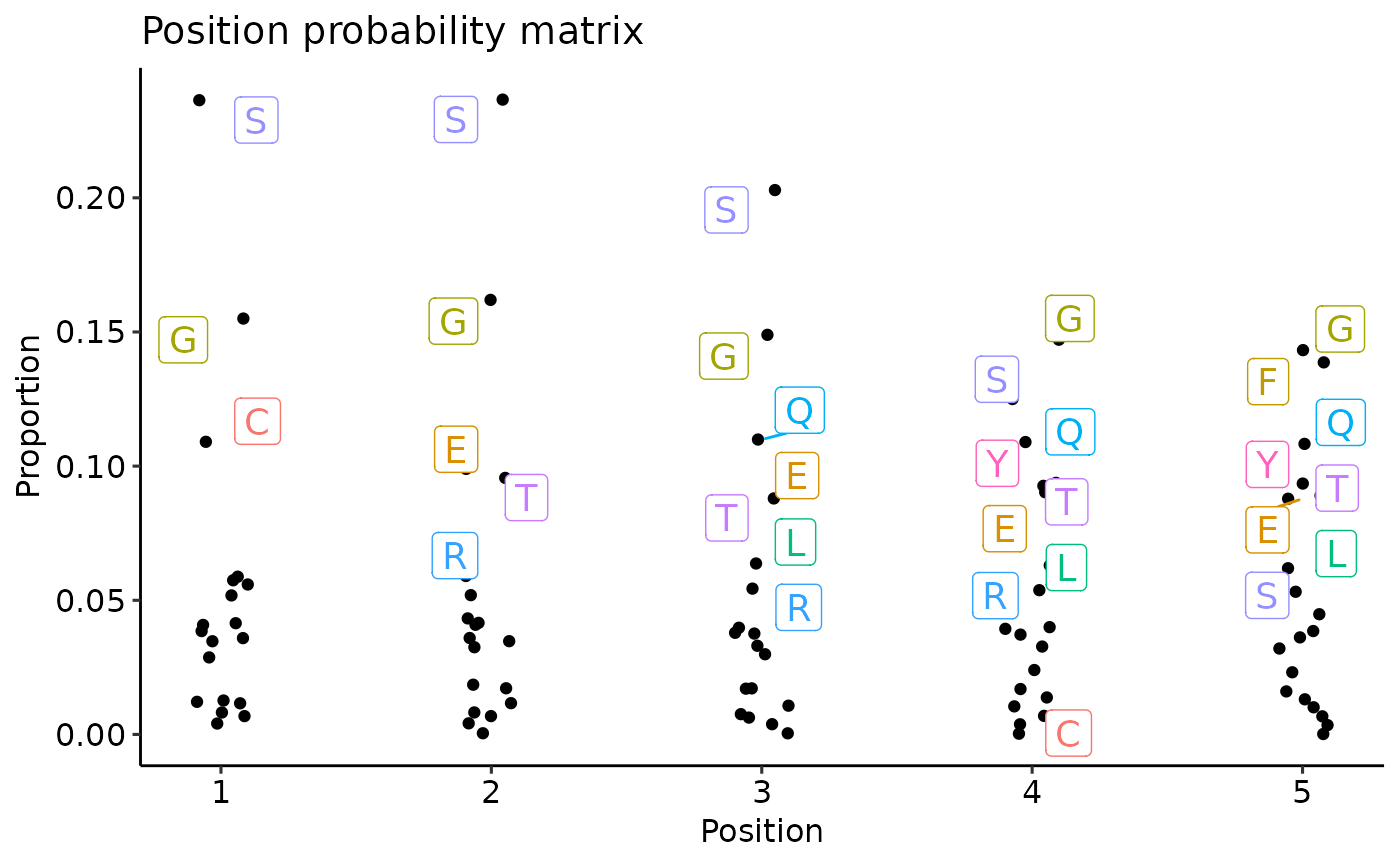
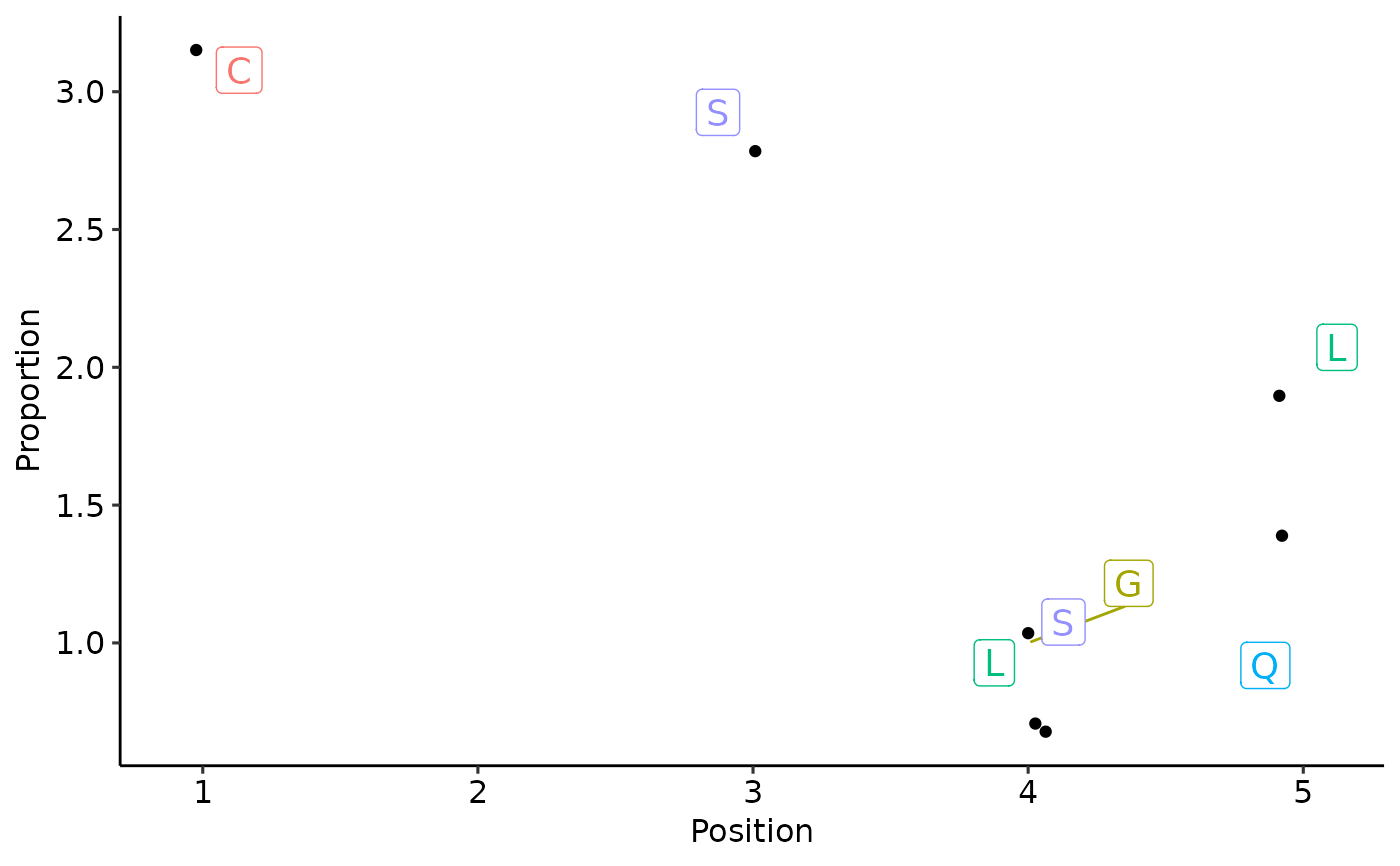
vis_textlogo plots sequences in a text format - each letter has the same height. Useful when there
are no big differences between occurences of amino acids in the motif.
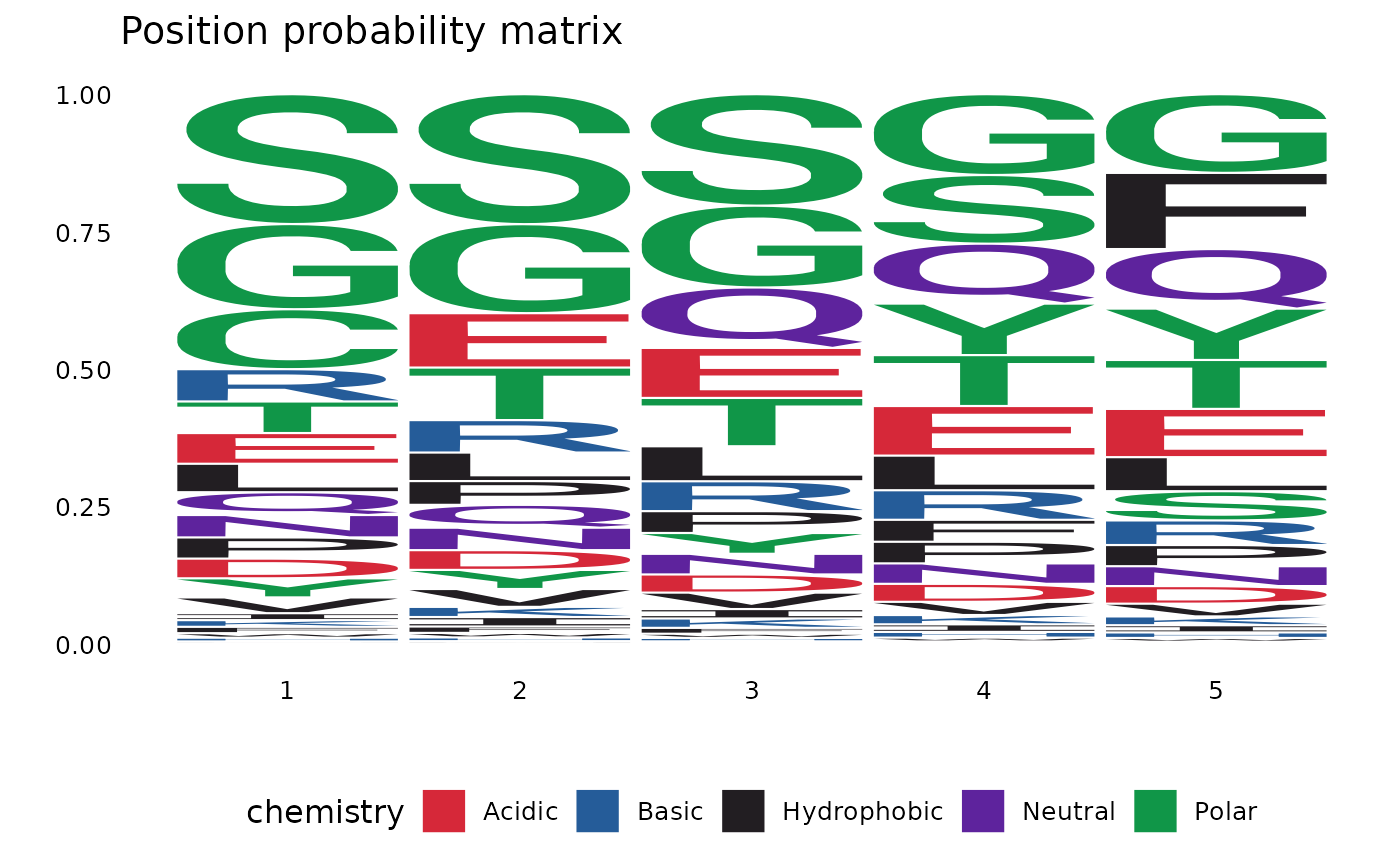
vis_seqlogo is a traditional sequence logo plots. Useful when there are one or two amino acids
with clear differences in their occurrences.
Usage
vis_textlogo(.data, .replace.zero.with.na = TRUE, .width = 0.1, ...)

vis_seqlogo(.data, .scheme = "chemistry", ...)
Arguments
- .data
Output from the
kmer.profilefunction.- .replace.zero.with.na
if TRUE then replace all zeros with NAs, therefore letters with zero frequency wont appear at the plot.
- .width
Width for jitter, i.e., how much points will scatter around the verical line. Pass 0 (zero) to plot points on the straight vertical line for each position.
- ...
Not used here.
- .scheme
Character. An argument passed to geom_logo from ggseqlogo package specifying how to colour symbols.
Examples
# \dontrun{
data(immdata)
kmers <- getKmers(immdata$data[[1]], 5)
ppm <- kmer_profile(kmers, "prob")
#> Warning: Warning: removed 5 non-amino acid symbol(s): A
#> Please make sure your data doesn't have them in the future.
vis(ppm, .plot = "text")
#> Warning: Removed 5 rows containing missing values or values outside the scale range
#> (`geom_point()`).
#> Warning: Removed 5 rows containing missing values or values outside the scale range
#> (`geom_label_repel()`).
#> Warning: ggrepel: 21 unlabeled data points (too many overlaps). Consider increasing max.overlaps
 vis(ppm, .plot = "seq")
 d <- kmer_profile(c("CASLL", "CASSQ", "CASGL"))
#> Warning: Warning: removed 1 non-amino acid symbol(s): A
#> Please make sure your data doesn't have them in the future.
vis_textlogo(d)
#> Warning: Removed 93 rows containing missing values or values outside the scale range
#> (`geom_point()`).
#> Warning: Removed 93 rows containing missing values or values outside the scale range
#> (`geom_label_repel()`).
d <- kmer_profile(c("CASLL", "CASSQ", "CASGL"))
#> Warning: Warning: removed 1 non-amino acid symbol(s): A
#> Please make sure your data doesn't have them in the future.
vis_textlogo(d)
#> Warning: Removed 93 rows containing missing values or values outside the scale range
#> (`geom_point()`).
#> Warning: Removed 93 rows containing missing values or values outside the scale range
#> (`geom_label_repel()`).
 vis_seqlogo(d)
 # }
# }