Post-analysis of public clonotype statistics: PCA, clustering, etc.
Source:R/v0_overlap_analysis.R
repOverlapAnalysis.Rd![[Deprecated]](figures/lifecycle-deprecated.svg)
The repOverlapAnalysis() function contains advanced data
analysis methods. You can use several clustering and dimensionality reduction
techniques in order to investigate further the difference between repertoires
provided.
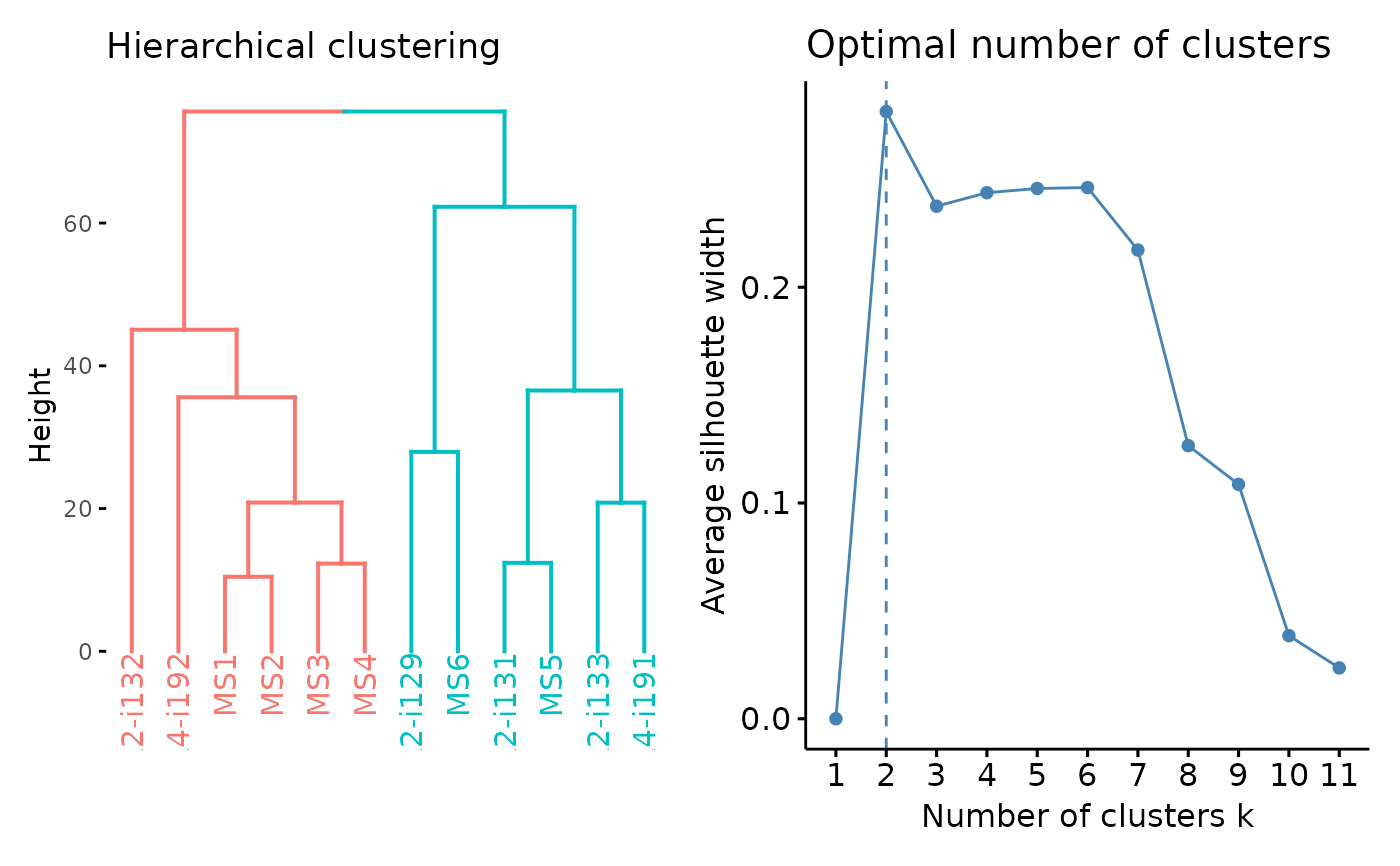
To cluster a subset of similar data with repOverlapAnalysis() you can
perform hierarchical clustering, k-means or dbscan ('hclust', 'kmeans', 'dbscan'
respectively).
To reduce dimensions, for example, to select features for subsequent analysis, you can execute the multidimensional scaling or t-sne algorithms ('mds' and 'tsne' respectively).
Usage
repOverlapAnalysis(
  .data,
  .method = ("hclust"),
  .scale = default_scale_fun,
  .raw = TRUE,
  .perp = 1,
  .theta = 0.1,
  .eps = 0.01,
  .k = 2
)
Arguments
- .data
Any distance matrix between pairs of repertoires. You can also pass your output from
repOverlap().- .method
A string that defines the type of analysis to perform.
- .scale
A function to scale the data before passing it to the MDS algorithm.
- .raw
A logical value. Set TRUE if you want to receive raw output of clustering or dimensionality reduction function of choice. Set FALSE if you want to receive processed output that can be subjected to visualisation with
vis()function.- .perp
A numerical value, t-SNE parameter, see
immunr_tsne().- .theta
A numerical value, t-SNE parameter, see
immunr_tsne().- .eps
A numerical value, DBscan epsylon parameter, see
immunr_dbscan().- .k
The number of clusters to create, passed as
kto hcut or ascentersto kmeans.
Value
Depends on the last element in the .method string. See immunr_tsne for more info.
Examples
data(immdata)
ov <- repOverlap(immdata$data)
repOverlapAnalysis(ov, "mds+hclust") %>% vis()