![[Deprecated]](figures/lifecycle-deprecated.svg)
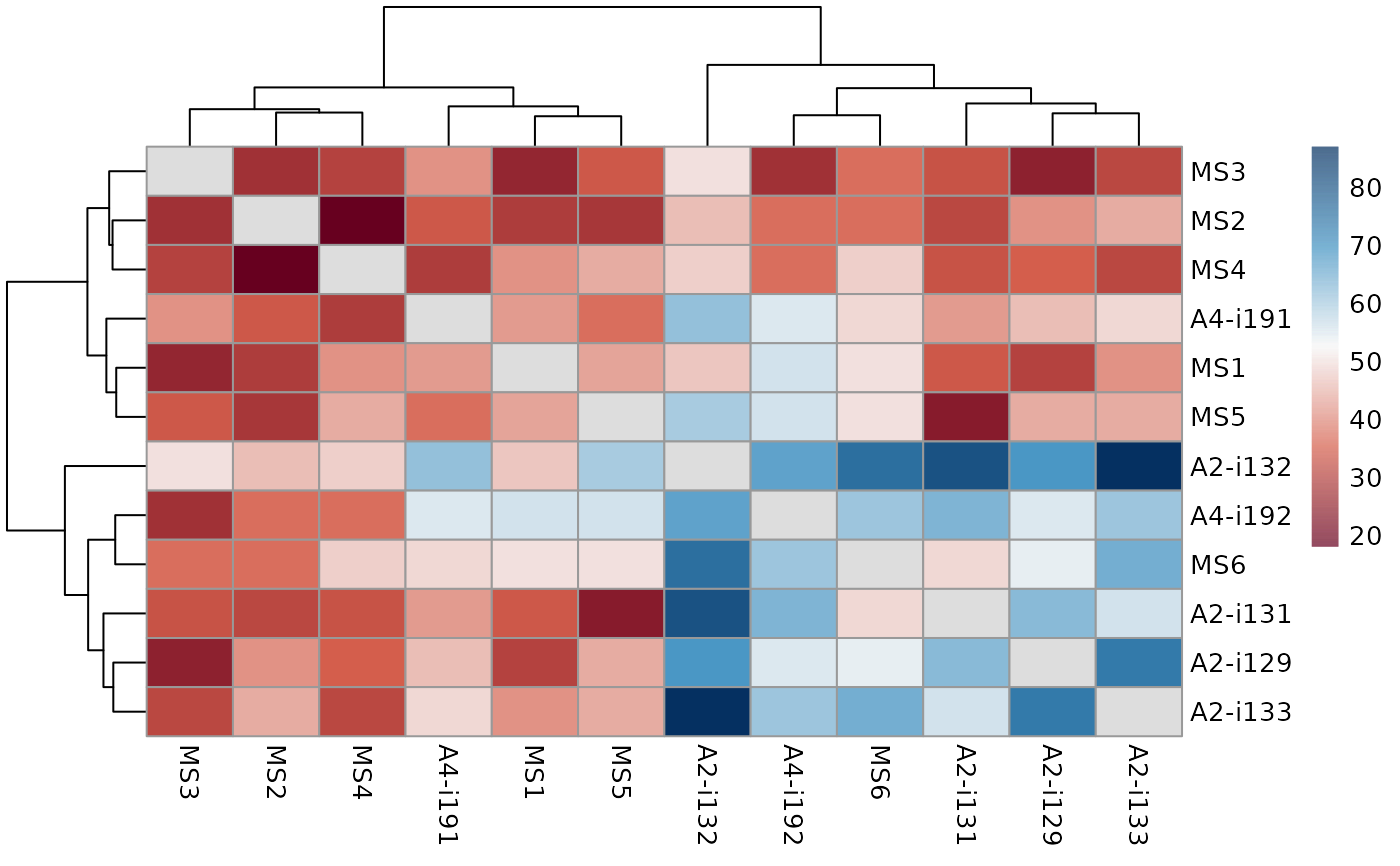
Visualise matrices with the functions based on the pheatmap package with minimum amount of arguments.
Usage
vis_heatmap2(
  .data,
  .meta = NA,
  .by = NA,
  .title = NA,
  .color = colorRampPalette(c("#67001f", "#d6604d", "#f7f7f7", "#4393c3",
    "#053061"))(1024),
  ...
)
Arguments
- .data
Input matrix. Column names and row names (if presented) will be used as names for labs.
- .meta
A metadata object. An R dataframe with sample names and their properties, such as age, serostatus or hla.
- .by
Set NA if you want to plot samples without grouping.
- .title
The text for the plot's title (same as the "main" argument in pheatmap).
- .color
A vector specifying the colors (same as the "color" argument in pheatmap). Pass NA to use the default pheatmap colors.
- ...
Other arguments for the pheatmap function.
Examples
# \dontrun{
data(immdata)
ov <- repOverlap(immdata$data)
vis_heatmap2(ov)

# }
# }