![[Deprecated]](figures/lifecycle-deprecated.svg)
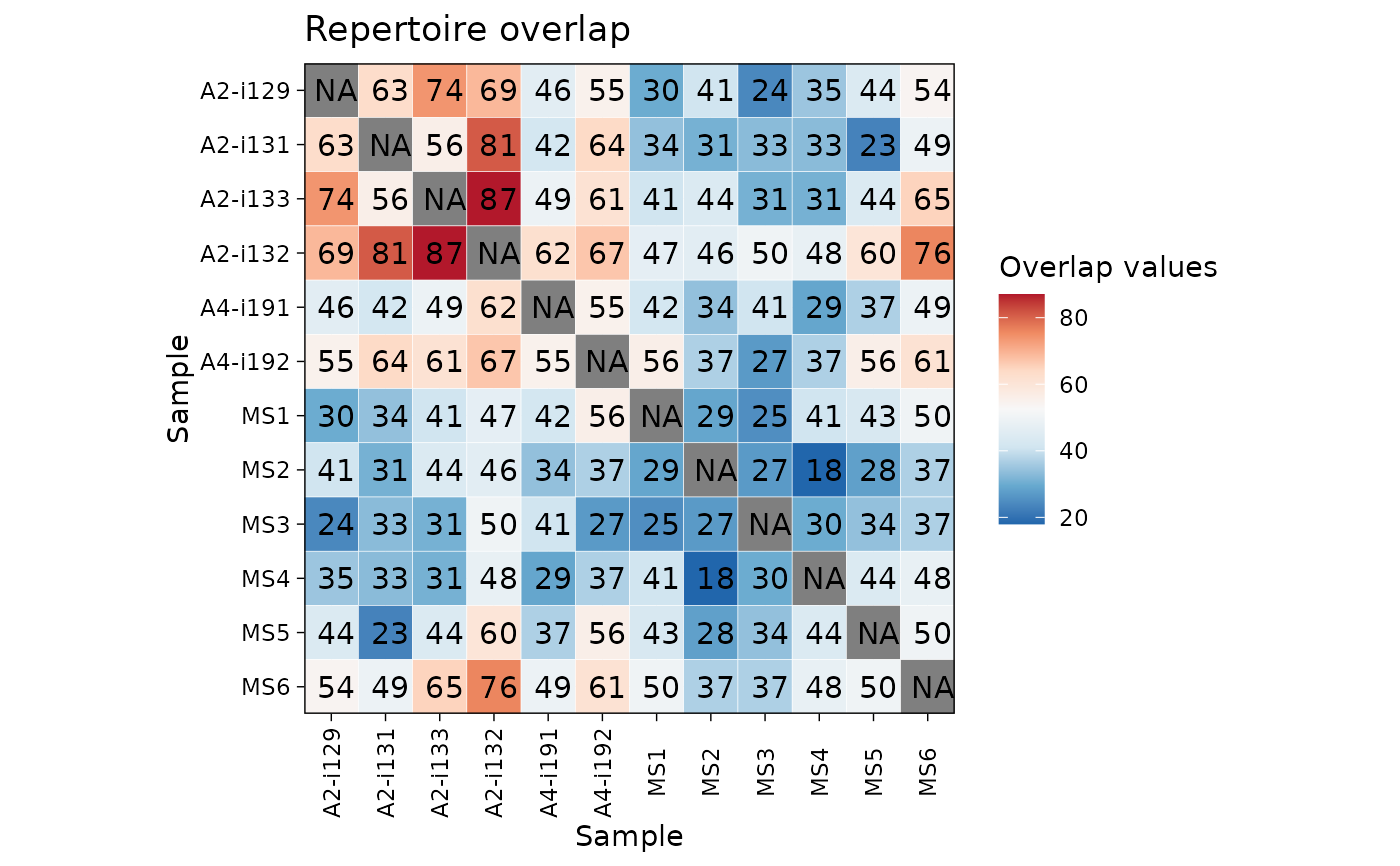
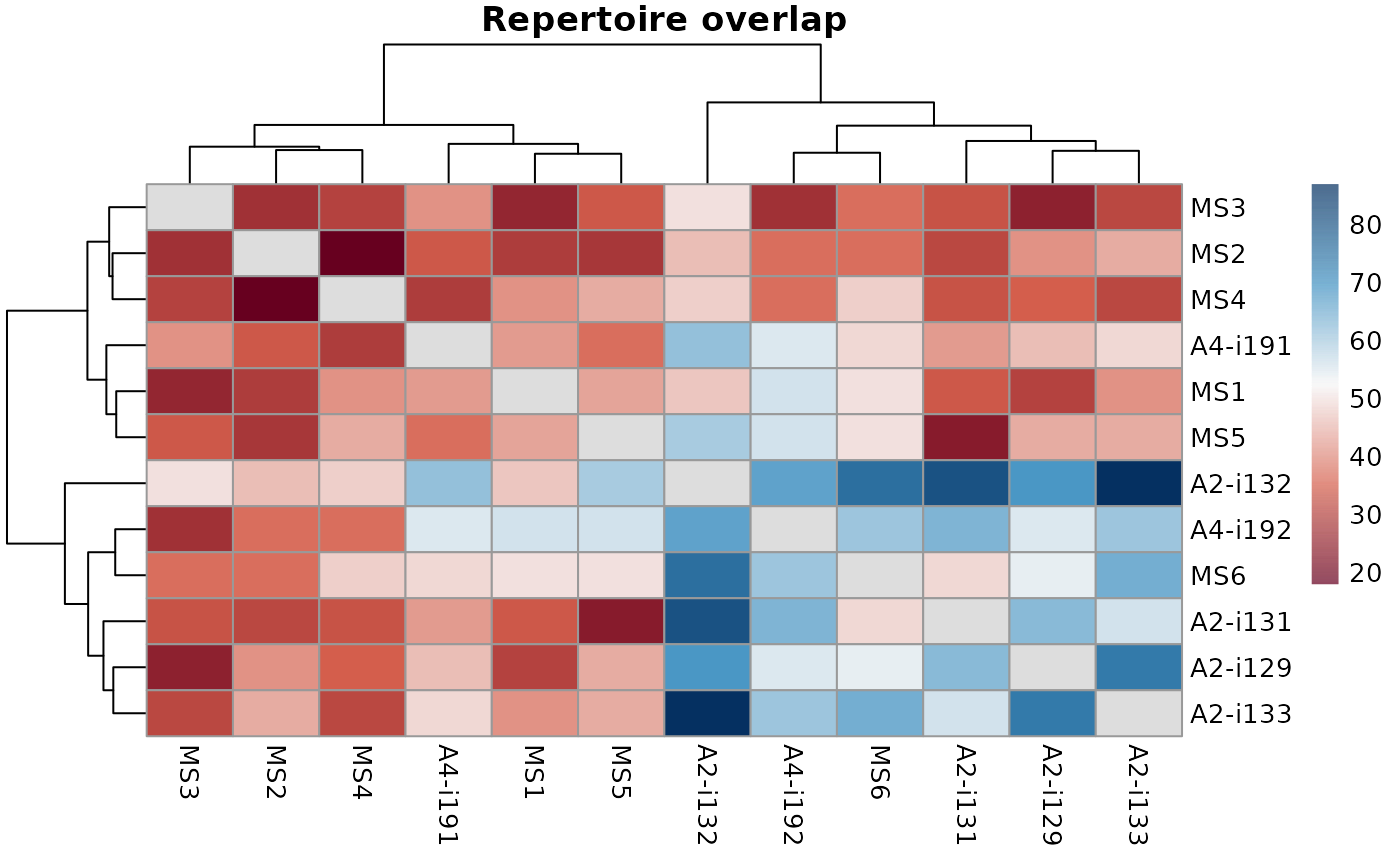
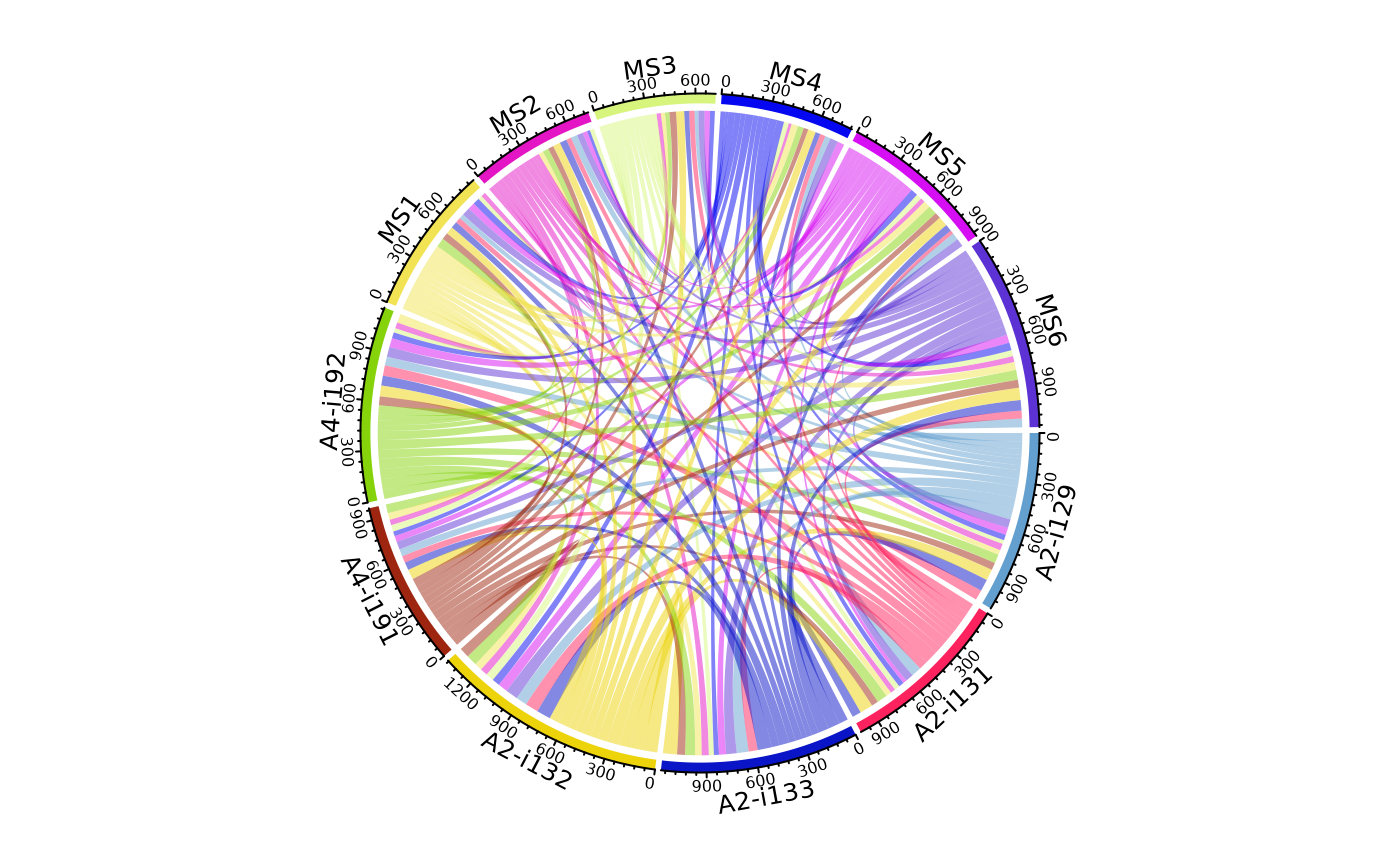
Visualises matrices with overlap values or gene usage distances among samples. For details see the links below.
Arguments
- .data
Output from repOverlap or geneUsageAnalysis.
- .plot
A string specifying the plot type:
"heatmap" for heatmaps using vis_heatmap;
"heatmap2" for heatmaps using vis_heatmap2;
"circos" for circos plots using vis_circos;
- ...
Other arguments are passed through to the underlying plotting function:
"heatmap" - passes arguments to vis_heatmap;
"heatmap2" - passes arguments to vis_heatmap2 and heatmap from the "pheatmap" package;
"circos" - passes arguments to vis_circos and circlize::chordDiagram from the "circlize" package;