![[Deprecated]](figures/lifecycle-deprecated.svg)
Arguments
- .data
Public repertoire, an output from pubRep.
- .plot
A string specifying the plot type:
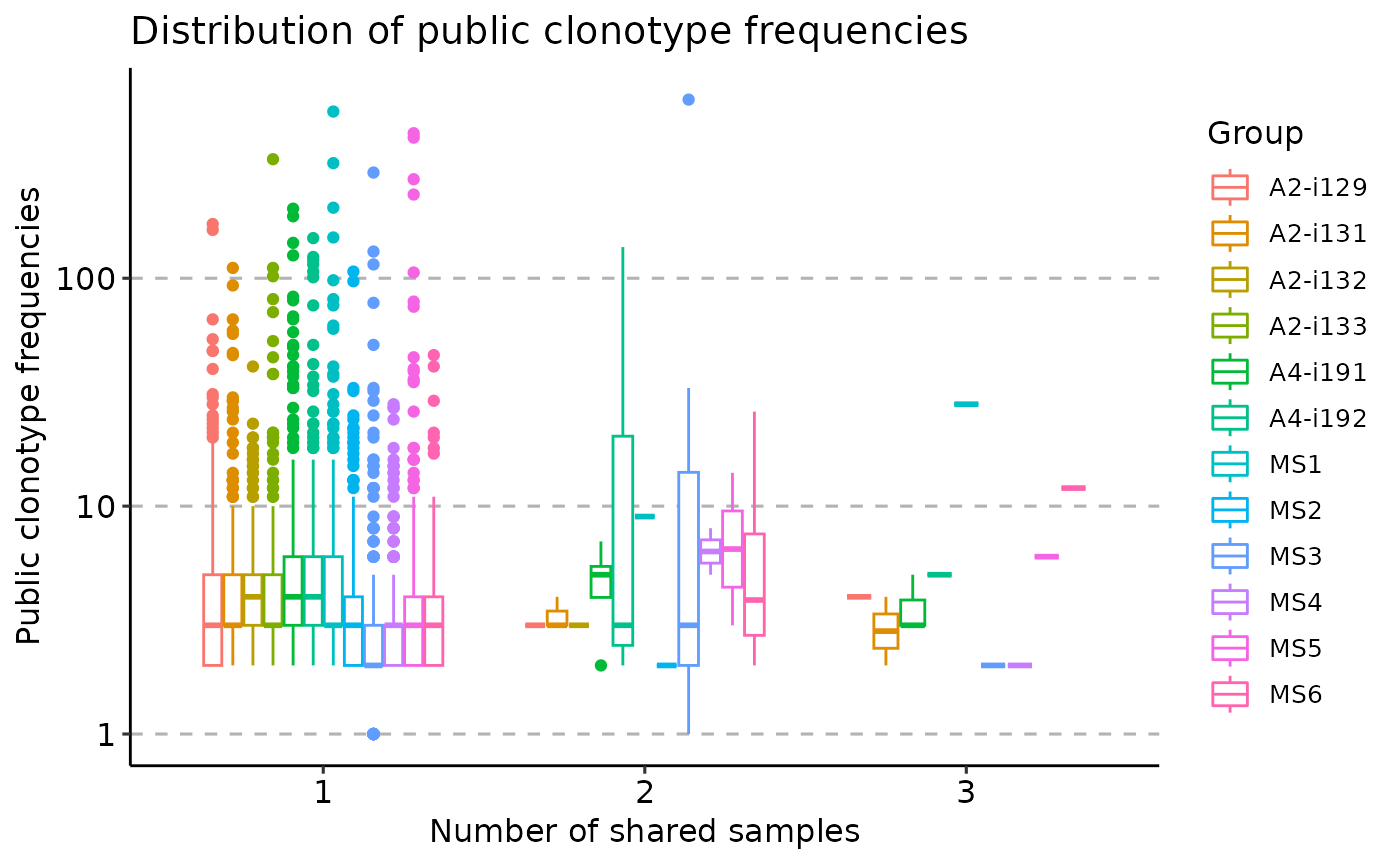
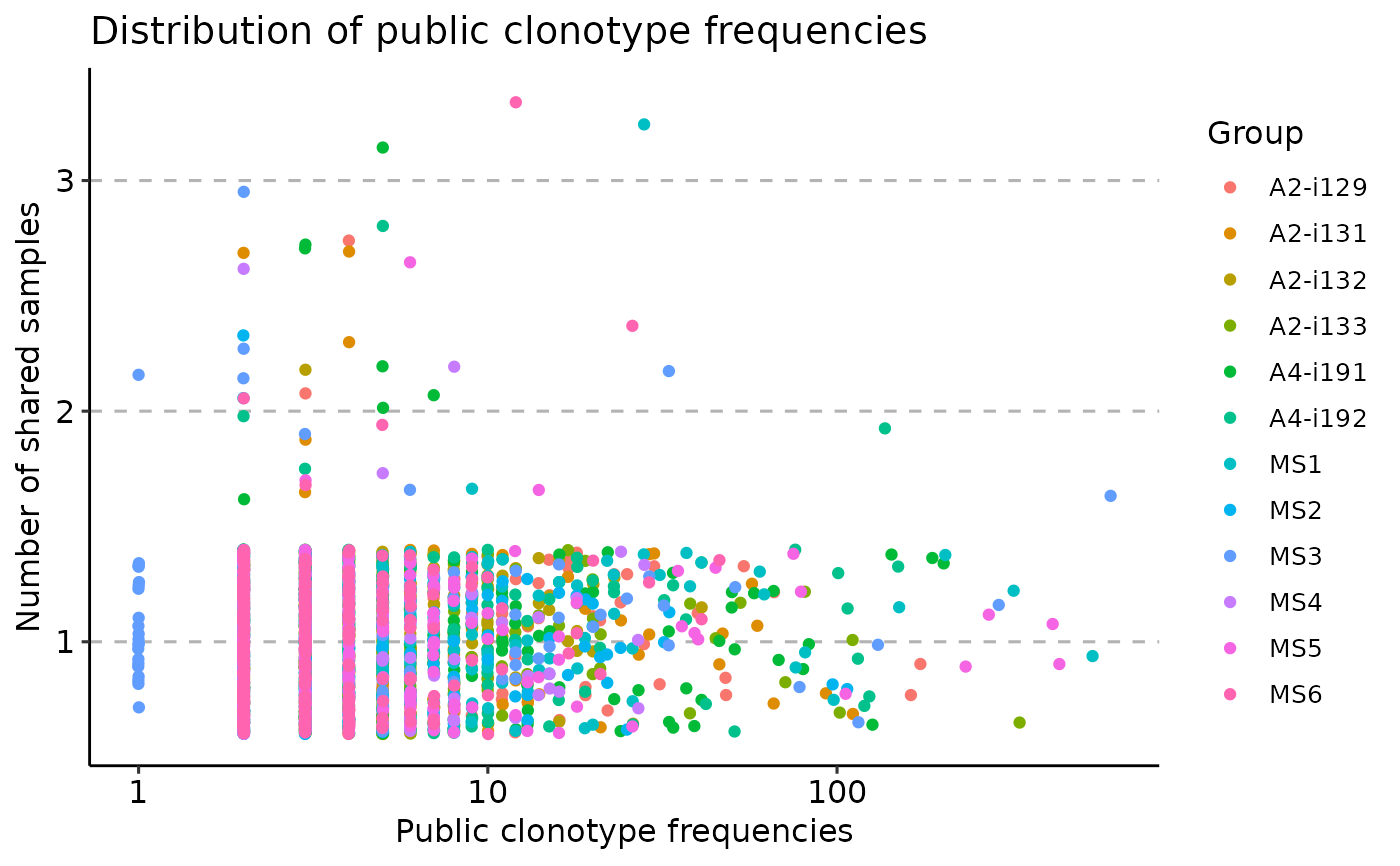
"freq" for visualisation of the distribution of occurrences of clonotypes and their frequencies using vis_public_frequencies.
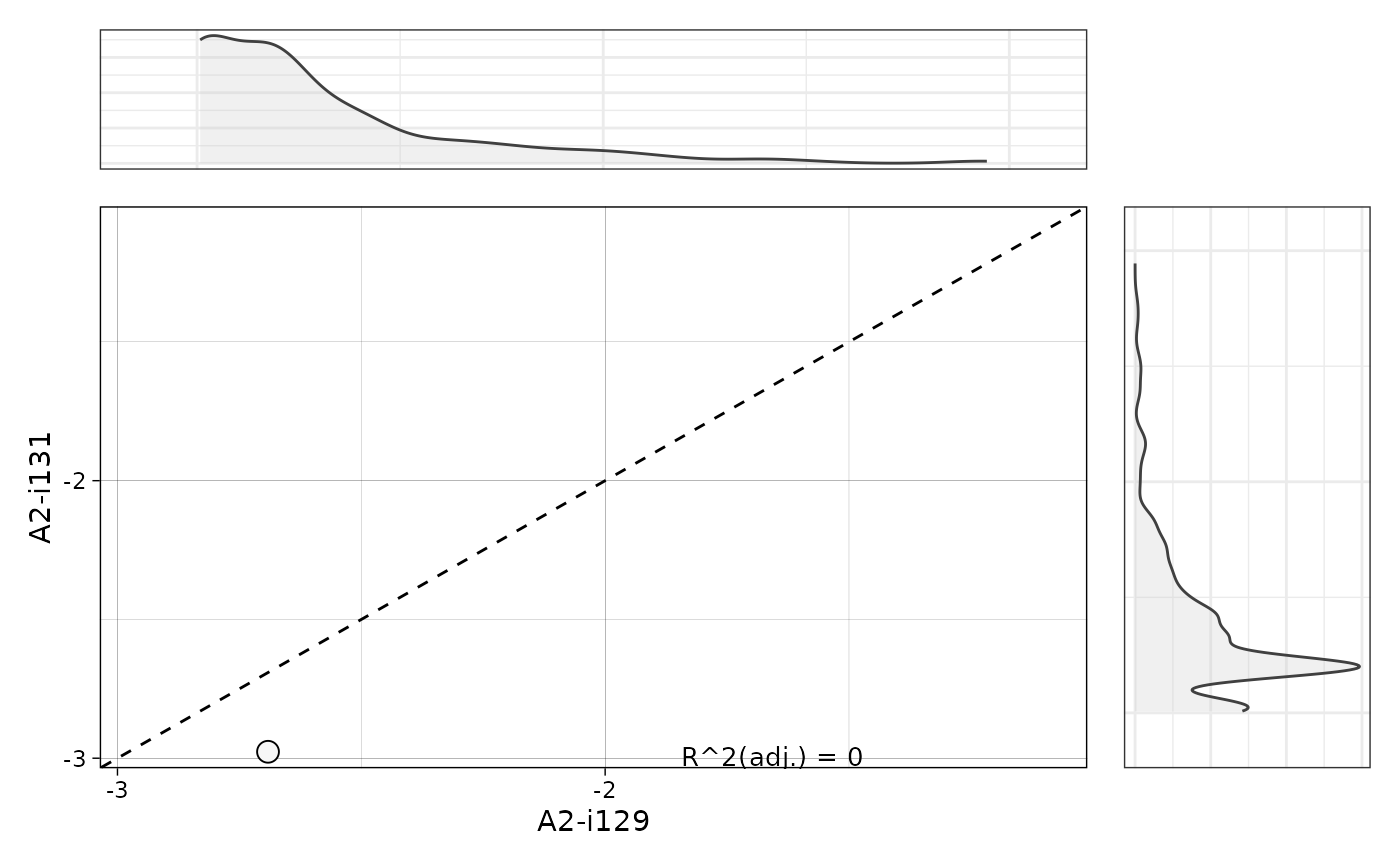
"clonotypes" for visualisation of public clonotype frequenciy correlations between pairs of samples using vis_public_clonotypes
- ...
Further arguments passed vis_public_frequencies or vis_public_clonotypes, depending on the ".plot" argument.
Examples
# \dontrun{
data(immdata)
immdata$data <- lapply(immdata$data, head, 300)
pr <- pubRep(immdata$data, .verbose = FALSE)
vis(pr, "freq")
#> Warning: Removed 38488 rows containing non-finite outside the scale range
#> (`stat_boxplot()`).
 vis(pr, "freq", .type = "none")
#> Warning! Visualising 3524 points. Too many points may take a while to visualise depending on your hardware. We highly recommend you to use other types: "mean" or "boxplot"
#> Warning: Removed 38488 rows containing missing values or values outside the scale range
#> (`geom_point()`).
vis(pr, "freq", .type = "none")
#> Warning! Visualising 3524 points. Too many points may take a while to visualise depending on your hardware. We highly recommend you to use other types: "mean" or "boxplot"
#> Warning: Removed 38488 rows containing missing values or values outside the scale range
#> (`geom_point()`).
 vis(pr, "clonotypes", 1, 2)
#> Warning: Groups with fewer than two data points have been dropped.
#> Warning: Removed 1 row containing missing values or values outside the scale range
#> (`geom_density()`).
#> `geom_smooth()` using formula = 'y ~ x'
#> Warning: Groups with fewer than two data points have been dropped.
#> Warning: Removed 1 row containing missing values or values outside the scale range
#> (`geom_density()`).
vis(pr, "clonotypes", 1, 2)
#> Warning: Groups with fewer than two data points have been dropped.
#> Warning: Removed 1 row containing missing values or values outside the scale range
#> (`geom_density()`).
#> `geom_smooth()` using formula = 'y ~ x'
#> Warning: Groups with fewer than two data points have been dropped.
#> Warning: Removed 1 row containing missing values or values outside the scale range
#> (`geom_density()`).
 # }
# }