![[Deprecated]](figures/lifecycle-deprecated.svg)
Visualise public clonotype frequencies.
Usage
vis_public_frequencies(
  .data,
  .by = NA,
  .meta = NA,
  .type = c("boxplot", "none", "mean")
)
Arguments
- .data
Public repertoire - an output from the pubRep function.
- .by
Pass NA if you want to plot samples without grouping.
You can pass a character vector with one or several column names from ".meta" to group your data before plotting. In this case you should provide ".meta".
You can pass a character vector that exactly matches the number of samples in your data, each value should correspond to a sample's property. It will be used to group data based on the values provided. Note that in this case you should pass NA to ".meta".
- .meta
A metadata object. An R dataframe with sample names and their properties, such as age, serostatus or hla.
- .type
Character. Either "boxplot" for plotting distributions of frequencies, "none" for plotting everything, or "mean" for plotting average values only.
Examples
# \dontrun{
data(immdata)
immdata$data <- lapply(immdata$data, head, 500)
pr <- pubRep(immdata$data, .verbose = FALSE)
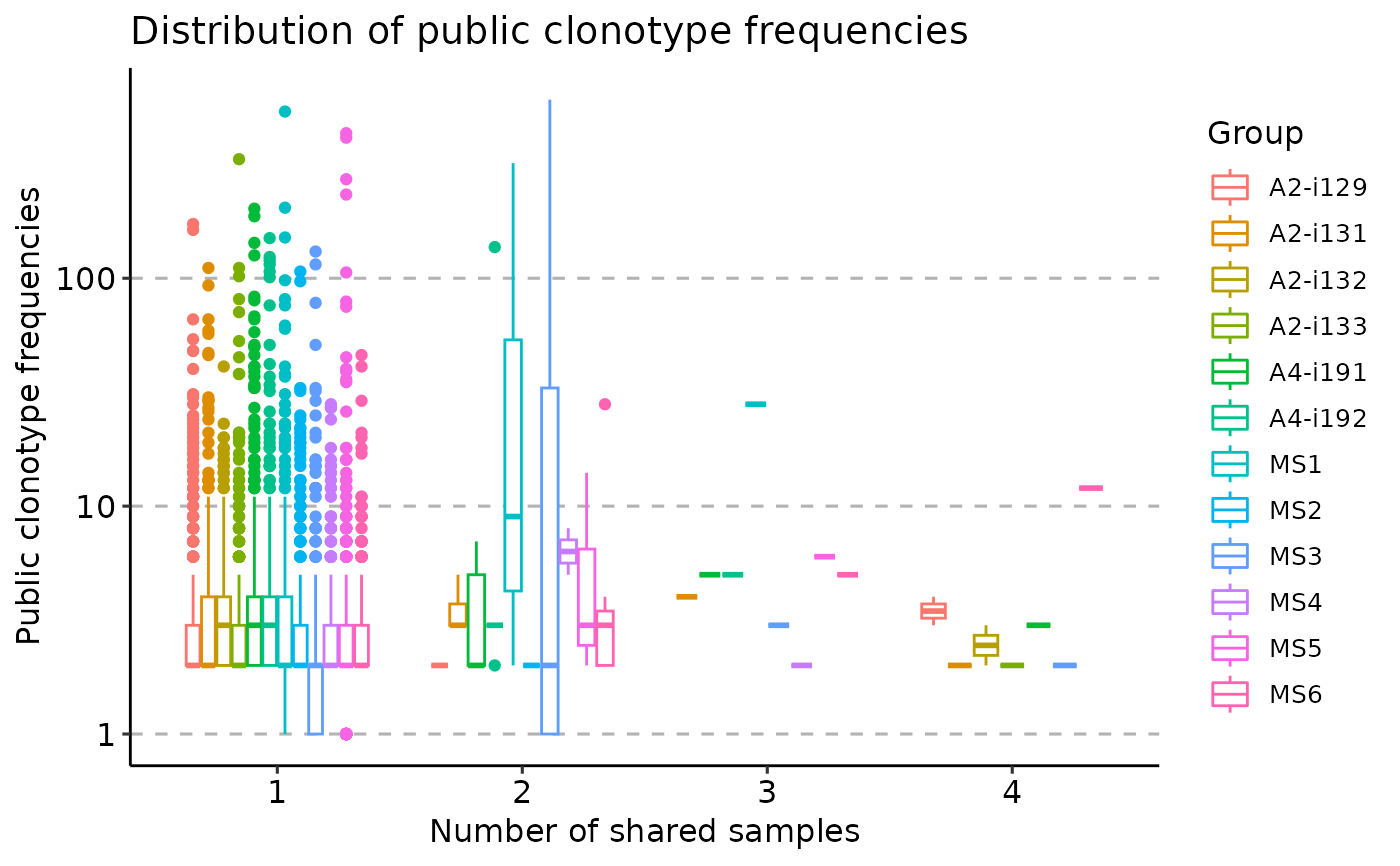
vis(pr, "freq", .type = "boxplot")
#> Warning: Removed 64256 rows containing non-finite outside the scale range
#> (`stat_boxplot()`).
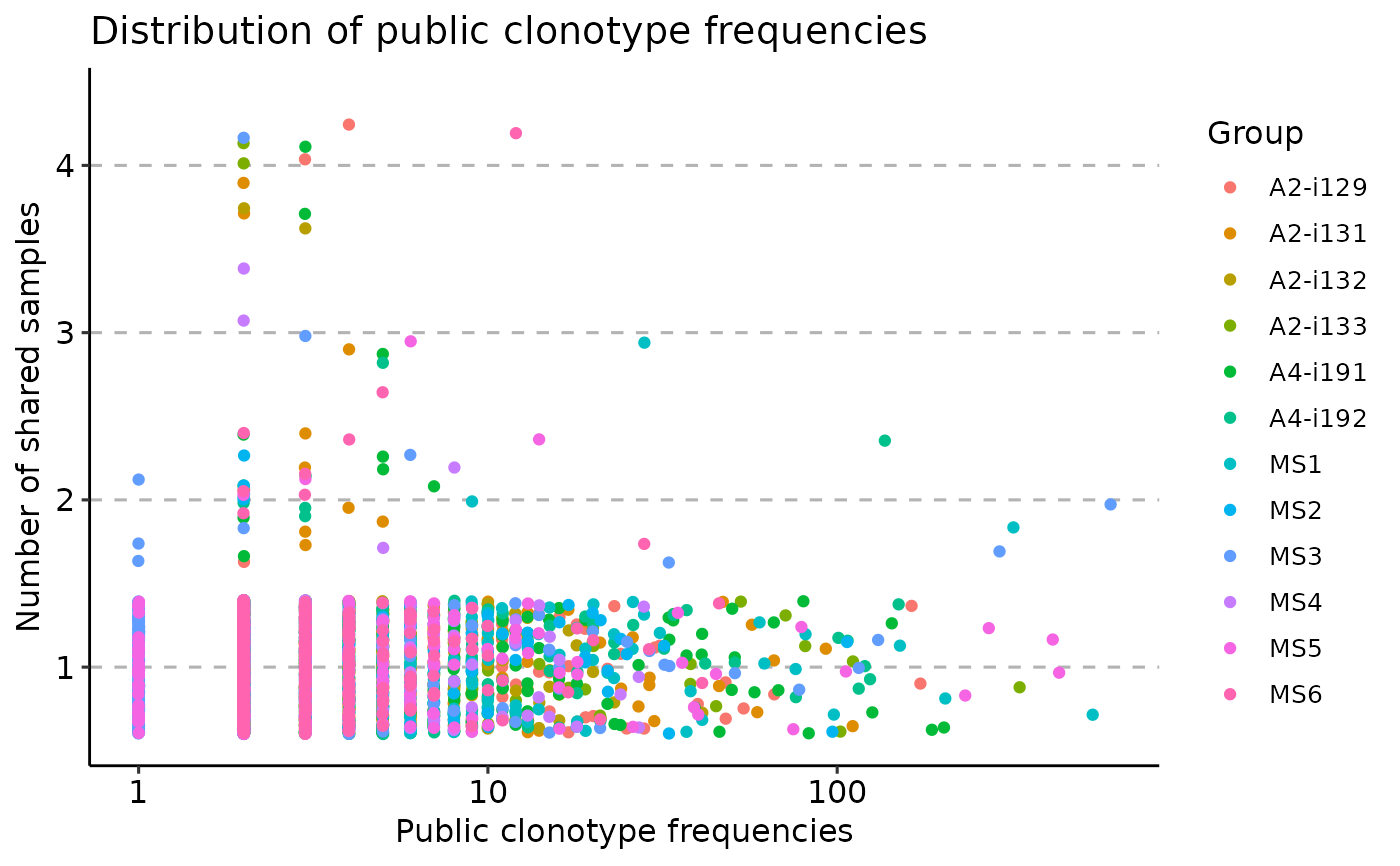
 vis(pr, "freq", .type = "none")
#> Warning! Visualising 5884 points. Too many points may take a while to visualise depending on your hardware. We highly recommend you to use other types: "mean" or "boxplot"
#> Warning: Removed 64256 rows containing missing values or values outside the scale range
#> (`geom_point()`).
vis(pr, "freq", .type = "none")
#> Warning! Visualising 5884 points. Too many points may take a while to visualise depending on your hardware. We highly recommend you to use other types: "mean" or "boxplot"
#> Warning: Removed 64256 rows containing missing values or values outside the scale range
#> (`geom_point()`).
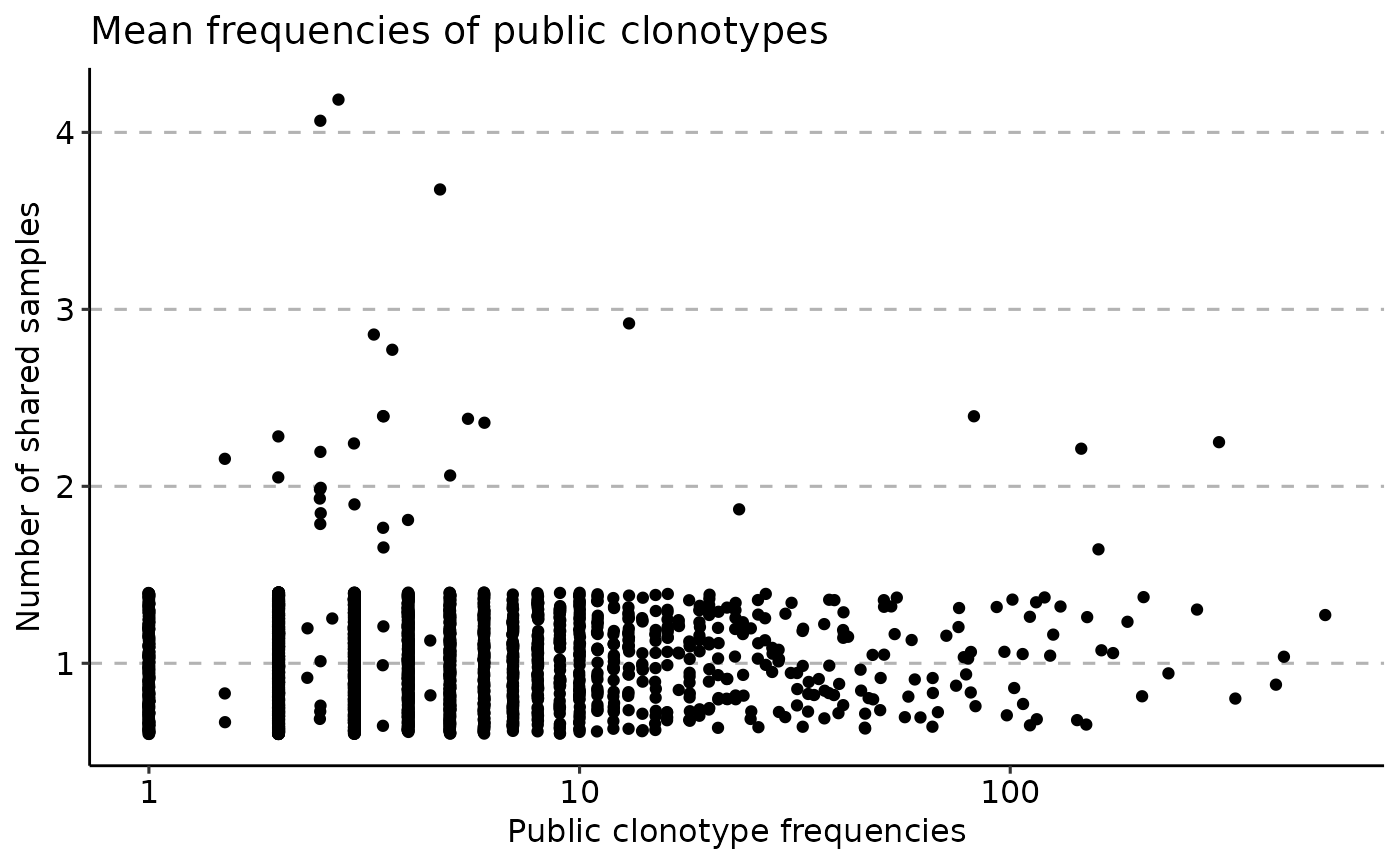
 vis(pr, "freq", .type = "mean")
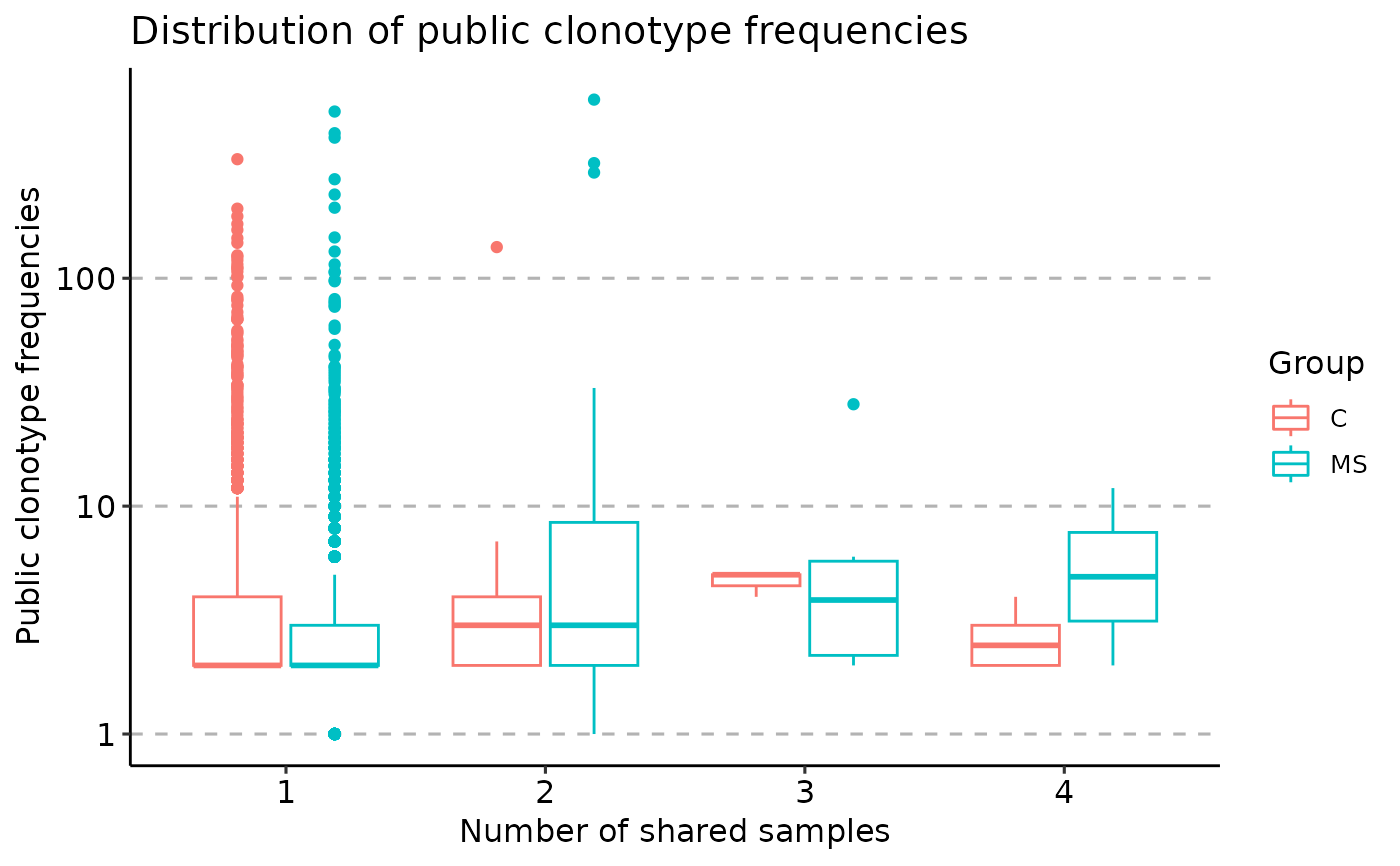
 vis(pr, "freq", .by = "Status", .meta = immdata$meta)
#> Warning: Removed 64256 rows containing non-finite outside the scale range
#> (`stat_boxplot()`).
vis(pr, "freq", .by = "Status", .meta = immdata$meta)
#> Warning: Removed 64256 rows containing non-finite outside the scale range
#> (`stat_boxplot()`).
 # }
# }