Main function for exploratory data analysis: compute the distribution of lengths, clones, etc.
Source:R/v0_explore.R
repExplore.Rd![[Deprecated]](figures/lifecycle-deprecated.svg)
The repExplore function calculates the basic statistics of
repertoire: the number of unique immune receptor clonotypes, their relative abundances,
and sequence length distribution across the input dataset.
Arguments
- .data
The data to be processed. Can be data.frame, data.table::data.table, or a list of these objects.
Every object must have columns in the immunarch compatible format. immunarch_data_format
Competent users may provide advanced data representations: DBI database connections, or a list of these objects. They are supported with the same limitations as basic objects.
Note: each connection must represent a separate repertoire.
- .method
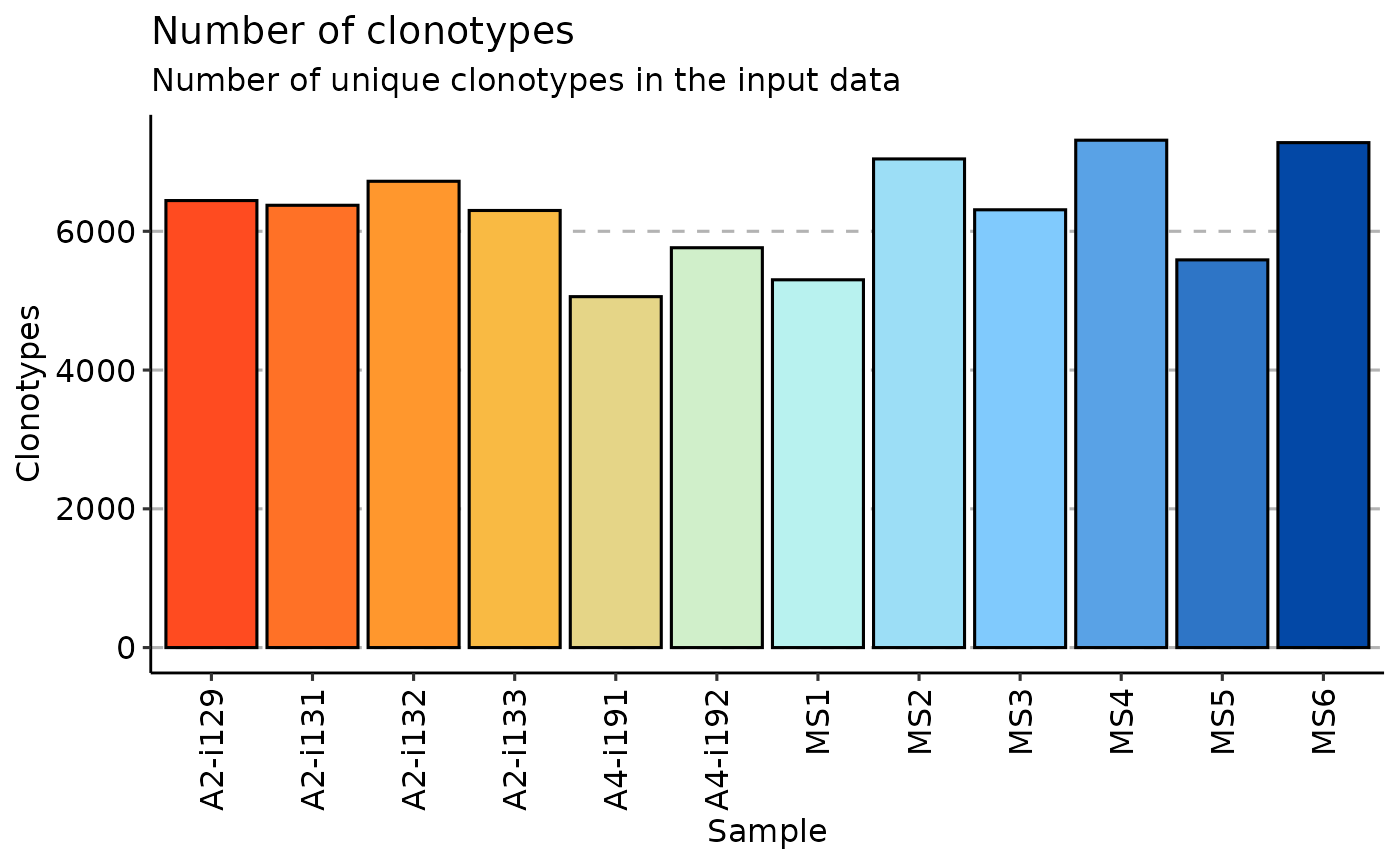
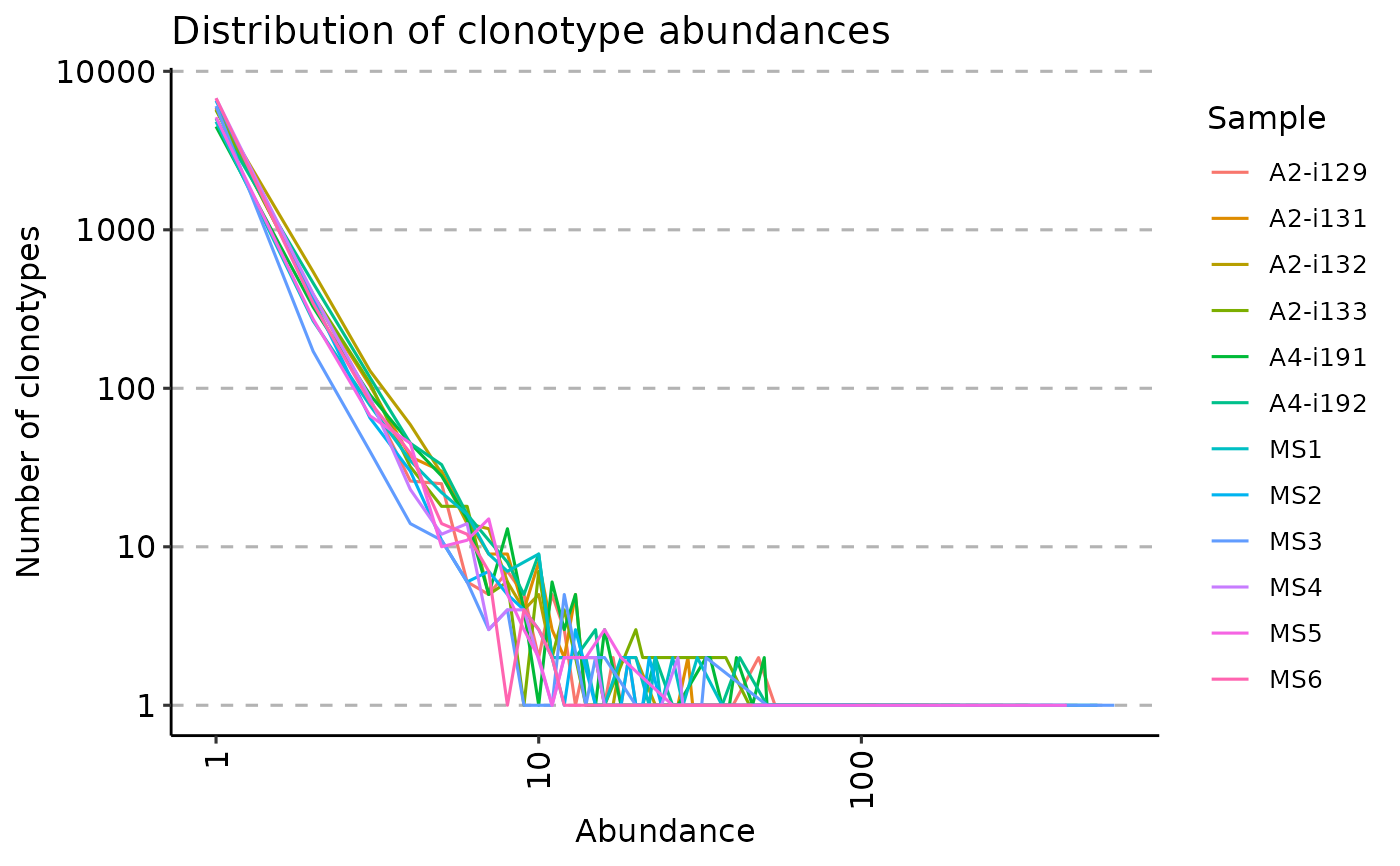
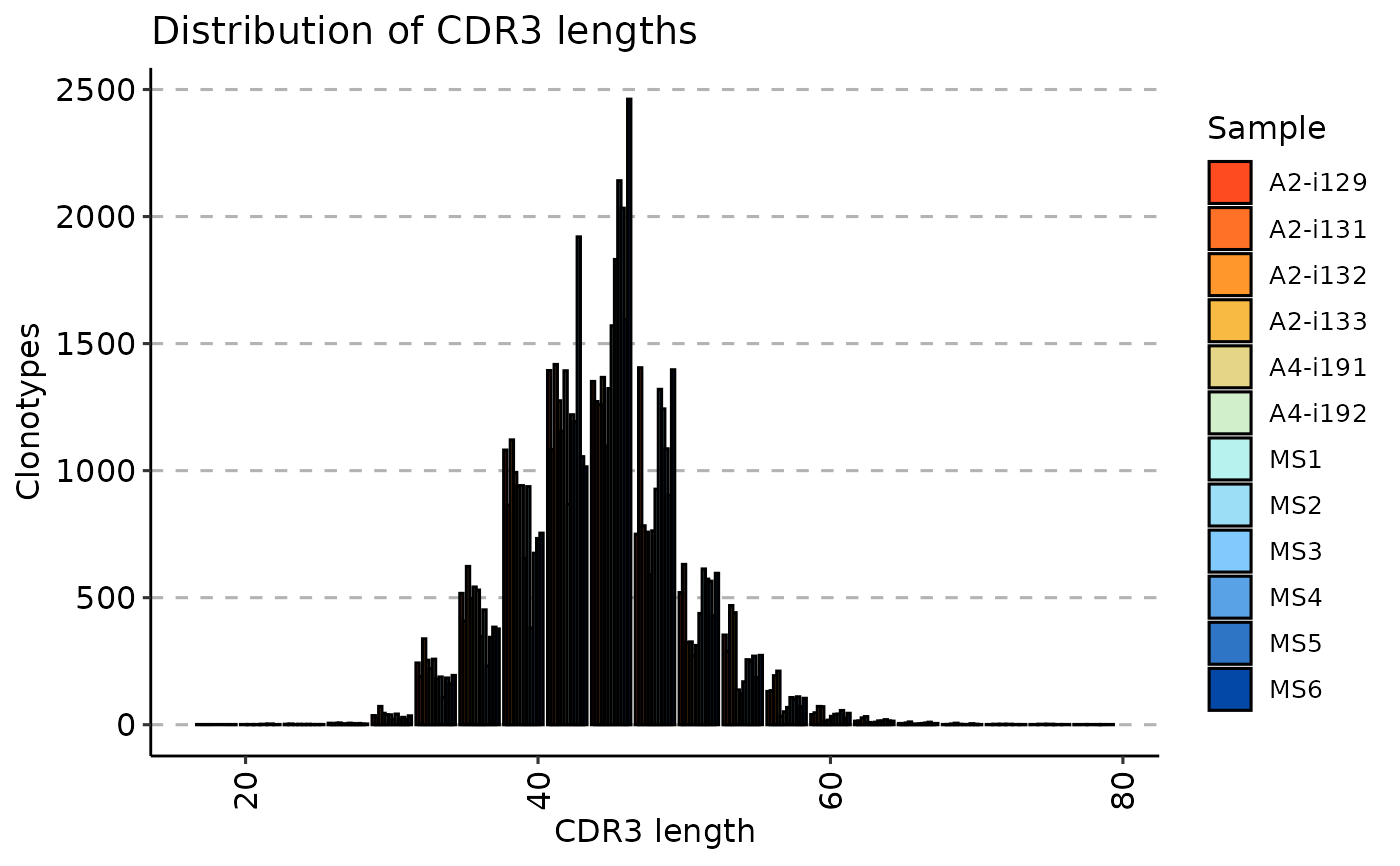
A string that specifies the method of analysis. It can be either "volume", "count", "len" or "clones".
When .method is set to "volume" the repExplore calculates the number of unique clonotypes in the input data.
When .method is set to "count" the repExplore calculates the distribution of clonotype abundances, i.e., how frequent receptors with different abundances are.
When .method is set to "len" the repExplore calculates the distribution of CDR3 sequence lengths.
When .method is set to "clones" the repExplore returns the number of clones (i.e., cells) per input repertoire.
- .col
A string that specifies the column to be processed. Pass "nt" for nucleotide sequence or "aa" for amino acid sequence.
- .coding
If
TRUE, then only coding sequences will be analysed.
Value
If input data is a single immune repertoire, then the function returns a numeric vector with exploratory analysis statistics.
Otherwise, it returns a numeric matrix with exploratory analysis statistics for all input repertoires.